
Introduction
You can enhance drawings with Hatches and color fills.
You can add Text notes and Tables to geometric entities and dimensions in drawings.
Hyperlinks associated to entities provide jumps to Web sites, email addresses, drawing files, or user-defined views.
Working with Hatches and Color Fills
You can fill enclosed areas of drawings with hatch patterns, solid color fills, or gradient color fills:
This chapter discusses:
- About Creating Hatches, Fills and Gradients
- Creating Hatches
- Creating Color Gradient Fills
- Modifying Hatches and Color Fills
About Creating Hatches, Fills and Gradients
Hatching a drawing adds meaning and helps to differentiate the materials and areas. Some drawing applications such as construction drawings require hatch patterns which can increase the clarity and legibility of a drawing.
Along with patterns, you can fill an enclosed area or specified entities with a solid color or a color gradient. Like hatches, color fills add meaning to drawings and help differentiate materials and areas.
This topic discusses:
- Adding Hatches, Fills and Gradients
- Selecting Hatch Patterns and Fills
- Specifying the Hatch Start Point
- Specifying Boundaries
- Detecting Boundaries in Complex Drawings
- Reshaping Hatches
- Setting the Hatch Display Options
Adding Hatches, Fills and Gradients
You can use the following commands to add hatches and fills:
- Hatch – Fills an enclosed area of specified entities with a hatch pattern.
- -Hatch – It is the command window variant of the Hatch command.
- FillArea – Fills an enclosed area or specified entities with a solid color or a color gradient.
Selecting Hatch Patterns and Fills
You can hatch areas using various hatch patterns or fill them with a specified color.
The following hatch options are available:
- Predefined patterns: ISO and ANSI conforming patterns, as well as patterns commonly used in specific industries.
- User-defined patterns: Patterns created by users.
- Custom patterns: Patterns determined by a specified Angle and Spacing.
- Solid hatch: Fill in a bounded area with the current color.
- Gradient fill: Fill in a bounded area with a color gradient. Various color gradient are available.
Additionally, you can create a hatch with the same properties as an existing one. See Setting Behavior Options for Hatch and Fill Boundaries.
Note: Use the MirrorHatch command to specify if hatches and gradient fills are reflected or retain their pattern direction when you apply Mirror and Flip commands.
Specifying the Hatch Start Point
By default, when hatching a closed area, the hatch pattern starts at the origin of the drawing. As a result, more complex hatch patterns might not align well with the boundary or with other hatches.
If you specify another starting point, at a suitable location, the software draws the hatch starting from the defined point. For example, you can align adjacent hatch patterns to match or apply a hatch pattern over another hatch pattern by setting a suitable starting points for their hatches.
You can define the hatch start point:
- At the current drawing origin (default)
- At a specified location within or outside the boundary
- At a corner point of the boundary
Specifying Boundaries
A boundary is a set of entities that forms a closed area. Entities that are not part of the boundary are ignored.
There are several methods to define the boundary:
- Selecting a set of entities that define a closed area.
- Specifying a point within a closed area: You need at least one point inside a closed area to create a boundary entity. To create other boundary entities, specify additional internal points.
- Drawing the boundary similarly to a polyline. (only -Hatch command)
Boundaries can include closed internal regions which you can hatch or not. Internal regions are internal closed areas that are completely within the boundary area.
 Note: If the area is not fully closed, the hatch boundary cannot be determined. However, you can define a gap tolerance so that the command ignores the gaps that are smaller than the defined value, considers the boundary closed and creates the hatch.
Additional options allow you to handle areas that are not closed and internal regions. See Setting Additional Options for Hatches and Gradient Fills.
Detecting Boundaries in Complex Drawings
Within a large drawing, you can optimize the boundary detection by specifying a set of entities to be analyzed when specifying a boundary by selecting an internal point.
To specify the set of entities you must define a so called group of entities which can include:
- Specified entities in the graphics area
- All visible entities from the current viewport
Specify the set of entities to be analyzed when specifying a boundary using an internal point. See Setting Additional Options for Hatches and Gradient Fills.
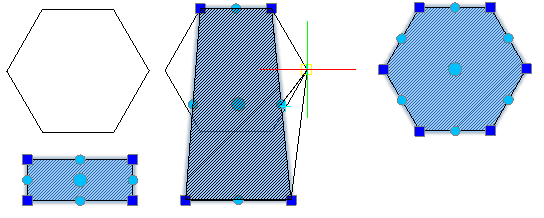
Reshaping Hatches
By default, hatches are linked to their boundary. You can reshape the hatch entity by editing the grip points of the hatch boundary. Changing the boundary shape automatically updates the shape of the hatch.
If you disable the link between the hatch and the boundary, you can directly manipulate the shape of the hatch according to a new boundary configuration using the hatch grip points. Hovering over a grip point on a non-associative hatch entity displays a menu with edit options according to the specified type of grip point. For example, for a linear segment, you can choose to convert the segment into an arc or to add a vertex.
Use this method to adjust a hatch whose original boundary has been deleted or moved to fill a new closed contour, such as PolyLines, Lines, Regions, Splines, Circles, Ellipses.
Note: The Keep hatch and boundary related option on the User Preferences page of the Options dialog box controls the link between the hatch and the boundary. Then, you can directly manipulate the shape of the hatch according to the new boundary configuration using the hatch grip points.
To reshape a hatch according to an existing boundary:
Before starting: Disable the Keep hatch and boundary related option on the User Preferences page of the Options dialog box.
- In the graphics area, specify the hatch to modify.
All grip points are displayed.
- Right-click a grip point and specify a vertex editing option from the context menu.
Note: According to the specified grip point, the options in the menu may vary.
- Stretch. Moves the hatch to a specified location.
- Insert vertex. Inserts an additional vertex at the midpoint of the next segment.
- Convert to arc / Convert to line. Converts the next segment to an arc if it is a linear segment or to a line if it is a curved segment. If you convert a linear segment to an arc segment, specify a point to force the arc to pass through.
- Delete vertex. Deletes the current vertex.
Example:
Setting the Hatch Display Options
Optionally, use the following options to better display and select hatched entities:
- Placement: By default, the hatch is created behind the hatch boundary to allow easier selection of the hatch boundary. You can create the hatch behind or in front of the hatch boundary, as well as behind or in front of all other entities. See Setting Behavior Options for Hatch and Fill Boundaries.
- Transparency: Lets you control the hatch transparency to better view the entities beneath the hatch. This option is useful especially for solid fills. See Setting Additional Options for Hatches and Gradient Fills.
- Annotative scaling: Lets you specify whether the annotative scaling is applied when you create or edit the hatch. When you change the scale of Viewports on Layouts Sheets, hatch entities automatically maintain the hatch size. This property ensures similar pattern sizes in Viewports on layout Sheets. See Setting Behavior Options for Hatch and Fill Boundaries.
Creating Hatches
Use the Hatch command to fill enclosed areas or specified entities with a hatch pattern. Hatching a drawing adds meaning and helps to differentiate the materials and areas. Some drawing applications such as construction drawings require hatch patterns which can increase the clarity and legibility of a drawing. Along with patterns, you can apply solid hatches to fill in a bounded area with the current color by selecting Solid from the Pattern list.
See Customizing Hatch Patterns to modify existing hatch patterns.
To hatch an area:
- Do one of the following:
- On the menu, click Draw > Hatch/Fill.
- Type Hatch.
- On the toolbar, click Hatch/Fill.
The Hatch / Fill dialog box appears.
When the ribbon is active, the Hatch Creation contextual ribbon tab appears. Otherwise, the Hatch / Fill dialog box appears.
- Do the following:
- Optionally, specify additional options for hatch and boundary:
- See Setting Additional Options for Hatches (annotative scaling, placement, transparency).
- See Setting Behavior Options for Hatch Boundaries.
- Click OK
 .
.
To hatch entities using properties of a selected hatch:
- Do one of the following:
- On the menu, click Draw > Hatch/Fill.
- Type Hatch.
- On the toolbar, click Hatch/Fill.
The Hatch / Fill dialog box appears.
When the ribbon is active, the Hatch Creation contextual ribbon tab appears. Otherwise, the Hatch / Fill dialog box appears.
- On the ribbon, click Hatch Creation > Mode > Match properties.
- On the Hatch tab, click Use properties of selected hatch.
- In the graphics area, specify the source hatch entity.
- In the Hatch / Fill dialog box, in Boundary settings, select a method to specify boundaries.
- Specify one or more internal points.
- In the graphics area, specify one or more boundaries.
- Press Enter.
- In the Hatch / Fill dialog box, click OK.
To set a hatch pattern:
- On the ribbon, click Hatch Creation > Pattern > Hatch pattern type.
- In the Hatch / Fill dialog box, click on the Hatch tab.
- Select a pattern type from the list.
- Predefined. Lets you select from predefined patterns including ISO and ANSI conforming patterns, as well as patterns commonly used in specific industries.
- User-defined. Lets you select a pattern you or your enterprise created.
- Custom. Lets you specify a pattern determined by your Angle and Spacing specifications.
- If you selected a Predefined type, select a pattern from the Pattern list. Alternatively, you can select and preview patterns in the Select Pattern Style dialog box.
- Click Select Pattern Style
 next to the Pattern list.
 - In the Select Pattern Style dialog box, browse through the available pattern style categories: ANSI, ISO, Sample, and Custom.
- Click on a pattern style to select it.
- Click OK.
- Click Select Pattern Style
The preview area displays the selected pattern.
To set hatch pattern alignment and scale:
- On the ribbon, click Hatch Creation > Properties.
- In the Hatch / Fill dialog box, on the Hatch tab, in Angle and Scale.
- Do the following:
- In Angle, specify an angle for the hatch pattern.
Standard hatch patterns are made up of horizontal or vertical lines or drawn at an angle. A hatch angle of 0 degrees defines a horizontal line. The Angle list contains angle values between 0 and 360 in 15 degree increments. A positive angle rotates the pattern counter-clockwise.
- Use the Scale list to specify a value by which to scale the hatch pattern.
The Scale list contains values between .25 and 2 in .25 unit increments (default is 1). For example, 2 doubles the distances in the pattern and .25 reduces the original dimensions by 1/4.
Note: User-defined patterns cannot be scaled. To change distances in user-defined patterns, use the Spacing list.
- In Angle, specify an angle for the hatch pattern.
- If you selected a User-defined type, in Spacing specify the distance between lines in the hatch pattern.
Specify the distance in drawing units (default is 1). Change the line spacing to customize the pattern proportions for specific graphics areas.
- If you selected an ISO Pattern type, use the ISO pen width list to select a pen width.
- Click Scale based on sheet’s units to adapt the units to the sheet.
- Click Scale sheet’s units to adapt the units to the sheet.
To set the hatch pattern start point:
- On the ribbon, click Hatch Creation > Pattern Start Point.
- In the Hatch / Fill dialog box, on the Hatch tab, in Pattern start point.
- Specify one of the following:
- Current drawing origin. Keeps the current hatch origin (default).
- User-defined location. Select Specify coordinates to specify a point in the graphics area or select User-defined location and specify a location relative to the boundary from the Use boundary list.
To save the specified location, enable Set as default.
To specify boundaries for hatch patterns:
On Hatch Creation, in Boundary Settings, select a method to specify boundaries.
In the Hatch dialog box, on the Hatch tab, select a method to specify boundaries.
| Button | Function | Description |
|---|---|---|
| Specify entities | Lets you select the entities that form the boundary. | |
| Specify points | Lets you click points in enclosed areas to define the boundaries. | |
| Rebuild boundary | Replaces a boundary after removing (enabled only when using the EditHatch command). | |
| Delete boundary entities | Removes boundaries from the set of entities that form the boundaries. | |
| Highlight boundary entities | Displays the boundaries in the drawing. |
Access
Command: Hatch
Menu: Draw > Hatch/Fill
Ribbon: Home > Draw > (Flyout) Hatch 
Toolbar: Hatch/Fill
Tool Palettes: Draw > Hatch
Creating Color Gradient Fills
Use the FillArea command to fill an enclosed area or specified entities with a solid color or a color gradient. Like hatches, color fills add meaning to drawings and help differentiate materials and areas.
To create a color fill:
- Click Draw > Hatch/Fill (or type FillArea).
- In the Hatch / Fill dialog box, select Fill.
- Configure the Colors of gradients by clicking One color or Two colors, selecting a a color by clicking
 , and applying the Dark Light slider.
Note: To create a uniform solid fill, click One Color, then enter 50 in the field next to the Dark-Light slider.
- Choose a color gradient style from the Style list:

- Update Orientation by setting the Angle and optionally selecting Symmetric to ensure the pattern is symmetric within the boundaries.
- Specify the Boundary settings.
-
Specify entities
 . Lets you select the entities that form the boundary.
 -
Specify points
 . Lets you click points in enclosed areas to define the boundaries.
 -
Rebuild boundary
 . Replaces a boundary after removing (enabled only when using the EditHatch command).
 -
Delete boundary entities
 . Removes boundaries from the set of entities that form the boundaries.
 -
Highlight boundary entities
 . Displays the boundaries in the drawing.
-
Specify entities
- Optionally, set additional options:
- Click Preview to view the color settings before applying.
- Click OK to apply the fill settings.
Access
Command: FillArea
Menu: Draw > Hatch/Fill
Ribbon: Home > Draw > (Flyout) Fill area
Tool Palettes: Draw > Fill Area
Modifying Hatches and Color Fills
You can modify the properties of hatch patterns, solid color fills, or gradient color fills:
- Editing Hatches and Fills
- Setting Additional Options for Hatches and Gradient Fills
- Setting Behavior Options for Hatch and Fill Boundaries
- Controlling the orientation of Hatches and Gradient Fills
Editing Hatches and Fills
You can modify hatch patterns, solid color fills, or gradient color fills. You can then add additional entities to the set of entities to be hatched or filled.
To edit a hatch pattern:
- Specify an existing hatch.
When the ribbon is active, the Hatch Editor contextual ribbon tab appears. Otherwise, click Modify > Entity > Hatch (or type EditHatch) to display the Hatch / Fill dialog box.
- On the Hatch Editor contextual ribbon tab you can modify:
-
Use the Hatch Editor contextual ribbon tab for:
- Setting Additional Options for Hatches and Gradient Fills
- Setting Behavior Options for Hatch and Fill Boundaries
- Controlling the Direction of Hatches and Gradient Fills
You can also add additional entities to the set of entities to be edited.
- Click Close.
To edit a color fill:
- Click Modify > Entity > Hatch (or type EditHatch).
- Specify an existing hatch.
- In the Hatch/Fill dialog box, select Fill to update the color fill.
You can also add additional entities to the set of entities to be edited.
To change a hatch to a fill or vice versa, select either Hatch or Fill in the Hatch/Fill dialog box and select the pattern or fill you want to apply.
Access
Command: EditHatch
Menu: Modify > Entity > Hatch
Ribbon: Home > Modify > (Flyout) Edit Hatch
Tool Palettes: Modify > Edit Hatch
Setting Additional Options for Hatches and Gradient Fills
When defining hatch boundaries by specifying internal points, the command detects the entities that form the boundary. In this case, additional options allow you to control the automatic detection of boundaries.
You can do the following:
- Detect or ignore internal closed boundaries
- Keep or delete the initial closed contour used when the hatch was created
- Specify a gap tolerance for hatching boundaries with gaps
- Specify the set of entities to be analyzed for boundary detection.
Optionally, use the Origin and Transparency options to better display hatched entities.
To detect or ignore internal closed boundaries:
- Click Find internal regions to detect internal closed boundaries.
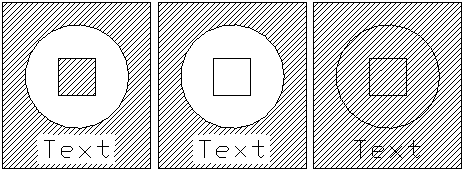
- On the Placement panel, in Display, specify a hatch display style to detect internal closed boundaries.
- Outer. Creates hatch patterns only in the outermost areas.
- Normal. Creates hatch pattern between alternate areas, starting with the outermost area (default).
- Ignore. Ignores the internal structure and hatches the entire area. Hatch lines pass through text, block attributes, and 2D solids.
- Click a hatch Display style.
-
Out
 . Creates hatch patterns only in the outermost areas.
 -
In/Out
 . Creates hatch pattern between alternate areas, starting with the outermost area (default).
 -
Ignore
 . Ignores the internal structure and hatches the entire area. Hatch lines pass through text, block attributes, and 2D solids.
-
Out
-
The following diagram illustrates the In/Out, Out, and Ignore styles.
To set the hatch default origin:
-
Select a default Origin setting. On the Placement panel, in Origin, select a default origin setting:
- Use current. Uses the origin point for the hatching specified with the current Hatch command.
- Use source. Uses the origin of existing hatches.
To keep the boundary used when the hatch was created:
Optionally, you can maintain the initial closed contour normally deleted when a hatch is created.
On the Mode panel:
- In Boundary preservation, click Keep boundaries.
- From the Type list, select whether the boundary contour is created as PolyLine or Region
To specify a gap tolerance for hatching boundaries with gaps:
If there are gaps between the entities selected for a boundary definition, the command does not create the hatch. Red circles appear at endpoints near the gap and a message displays. However, you can define a gap tolerance so that, when creating the hatch, gaps equal to or smaller than the specified value are ignored. The command considers the boundaries closed and creates the hatch. If the gap is greater than the specified tolerance value, the message informs you that the hatch cannot be created.
You cannot select and manipulate the red circles. Use Rebuild or RebuildAll if you no longer need them displayed.

On the Additional Options panel:
In the Additional Options dialog box
- In Gaps, specify a Maximum gap size.
Gaps equal to or smaller than the specified value are ignored.
- In Gaps, specify a maximum gap size.
Gaps equal to or smaller than the specified value are ignored and the hatch is created.
To specify the set of entities for the boundary detection:
- In Boundary group, do one of the following:
- Select Active View Tile to create a boundary group from all visible entities from the current viewport.
– or –
- Click to select entities for the boundary.
- In the graphics area, specify the entities and press Enter.
- Click
- Select Active View Tile to create a boundary group from all visible entities from the current viewport.
To set the target Layer for subsequent hatches and fills:
On the Additional Options panel:
- From the Layer list, select the name of a Layer for subsequent hatches or fills, or select <Active> to place subsequent hatches or fills on the currently activated Layer.
The setting is valid for the current drawing and stored in the drawing. <Active> is the default for new drawings, unless the template file for the drawing sets a specific Layer name.
To set the hatch line color:
On the Additional Options panel:
- In LineColor, specify the color of the hatch lines:
- ByBlock. Uses the current line color setting of a block, if the line color is contained in that Block.
- ByLayer. Uses the current layer line color setting.
- Specify color. Lets you specify a standard or a custom color for the hatch line.
To set the hatch background color:
On the Additional Options panel:
- In Background color, specify the color of the hatch background. The Specify color option lets you specify a standard or a custom color for the hatch background.
To specify hatch or fill transparency level:
On the Additional Options panel:
- In Transparency, specify the transparency level of the hatch or fill:
- Use current. Uses the current transparency setting for new entities.
- ByLayer. Uses the current layer transparency setting.
- ByBlock. Uses the current transparency setting of a block, if the hatch or fill is contained in that Block.
- Specify value. Uses the transparency setting that you specify by either entering a value in the text box or using the slider. Specify a value between 0 and 90% where 0% means no transparency (opaque).
Access
Command: Hatch
Menu: Draw > Hatch
Tool Palettes: Draw > Hatch
Setting Behavior Options for Hatch and Fill Boundaries
Optionally, use the following options to better display and select hatched entities:
-
Annotative scaling.
Specifies whether annotative scaling is applied when you create or edit the hatch or the gradient. When you change the scale of Viewports on layout Sheets, hatch entities automatically maintain the hatch size. This property ensures similar pattern sizes in Viewports on layout Sheets.
-
Keep hatch and boundary related.
Updates hatch patterns and gradients automatically if the boundary changes (default). This option is not available if you selected Annotative scaling.
By default, hatches and gradients are linked to the boundary and therefore, automatically update when the boundary changes. You can remove the link at any time and create hatches and gradients that are independent of their boundaries. Additionally, you can add or remove grip points that let you manually change the hatch shape according to a new boundary.
-
Create hatch for each boundary.
Generates distinct hatches or filled area with the same properties if you are adding boundaries of several areas at once. Do not enable this option if one connected hatch or gradient is required.
-
Use properties of selected hatch.
Generates hatch or fill with the same properties as a selected hatch entity. Click
 and specify a hatch in the drawing.
 -
Placement.
By default, hatches and fills are created behind their boundaries to allow easier selection of the boundaries. You can create the hatch and the fill behind or in front of the boundary, as well as behind or in front of all other entities. Select Bring to Front, Send to Back, Bring in Front of Boundary, Send Behind Boundary (default), or Do Not Assign.
Access
Command: Hatch
Menu: Draw > Hatch/Fill
Controlling the Direction of Hatches and Gradient Fills
Use the MirrorHatch command to specify if hatches and gradient fills are reflected or retain their pattern direction when you apply Mirror and Flip commands.
To control the direction of hatches and gradient fills:
- Type MirrorHatch at the command prompt.
- Specify an option:
- On. Turns on the mirroring of hatches and gradient fills.
- Off. Turns off the mirroring of hatches and gradient fills.
Access
Command: MirrorHatch
Working with Text
You can add Text to provide drawings with detailed information or annotations:
- Working with TextStyles
- Creating Notes
- Creating SimpleNotes
- Editing Annotations
- Setting Note Editing Options
- Inserting Fields
- Updating Field Information
- Setting the Background for Fields
- Finding and Replacing Text
- Checking Spelling
Working with TextStyles
Use the TextStyle command to create, edit, activate, or delete TextStyles in drawings.
When you add Notes or SimpleNotes to a drawing, it uses the active TextStyle. A TextStyle is defined by font, type face characteristics, size, and other properties.
You can use TrueType fonts or compiled shape fonts (of type .shx).
The TextStyle command loads fonts from files and customizes them to the drawing requirements.
You can define TextStyles to apply annotative scaling for Notes and SimpleNotes.
To create TextStyles:
- Click Format > Text Style (or type TextStyle).
In the Options dialog box, the Drafting Styles page opens and Text expands.
- Click New.
- In the Create new TextStyle dialog box, type a new name and click OK.
The new TextStyle appears in Style.
- Under Text, set:
- Font. Lists all installed TrueType fonts provided with your operating system by font family name. Fonts of type .shx are listed by the name of the file where they are stored.
- Format. Lists formats you can apply to the font (Normal, Italic, Bold, Bold Italic, for example, for TrueType fonts). While creating a TextStyle, the command displays a default font style dependent on the selected font name. When you make changes to the default name in Style, a new default name is no longer suggested and your changes become the new default.
- Big font. Lists all files that have big fonts which are stored in .shx files.
- Under Height, set:
-
Annotative Scaling. Specifies whether annotative scaling is used for Notes and SimpleNotes which apply the TextStyle you define. In Style, annotative TextStyles are marked with an
 .
. -
Match text orientation to Sheet. Specifies whether the orientation of Notes and SimpleNotes in Viewports of layout Sheets follows the Sheet orientation.
This option is available only if you selected annotative scaling.
-
Height or Sheet text height. Sets the TextStyle height in drawing units.
- Height. If the TextStyle is not defined for annotative scaling: A numeric value sets the font at a fixed height that you cannot change when inserting a Text entity that uses the selected Font. Set Height to 0.0 if you need to change the TextStyle height.
- Sheet text height. If the TextStyle is defined for annotative scaling: A numeric value sets the font at a fixed height that you cannot change when inserting a Text entity that uses the selected Font. Set Height to 0.0 if you need to change the TextStyle height.
-
Annotative Scaling. Specifies whether annotative scaling is used for Notes and SimpleNotes which apply the TextStyle you define. In Style, annotative TextStyles are marked with an
- Under Orientation, set:
- Backwards. Displays a mirror-image of the text. Applies to SimpleNotes, not Notes.
- Upside down. Displays text upside down. Applies to SimpleNotes, not Notes.
- Vertical. Aligns the text vertically. Applies to SimpleNotes, not Notes. This option is available only for *.shx font files that support dual orientation.
- Angle. Defines the inclination of the characters in relation to a horizontal (X-axis) line. Values between 0 and 84.90 result in an inclination to the right (forward), values between 0 and -84.9 result in an inclination to the left (backward).
-
Spacing. Controls the width of the characters in relation to the height. This relation is called the aspect ratio.
You can combine these settings, although in some cases the combination of properties can interfere with each other. Some fonts do not support all options.
The Preview area displays the TextStyle you define with the specified font and parameters. You can edit the Preview text.
To edit TextStyles:
When you edit TextStyles, all existing Text entities that use the TextStyle automatically update to reflect the modified style.
- Click Format > Text Style (or type TextStyle).
In the Options dialog box, the Drafting Styles page opens and Text expands.
- In Style, select a TextStyle.
The Style list contains all TextStyles that are defined in the drawing. You cannot change the name of the Standard TextStyle, but you can edit its settings.
- Set options under Text and Orientation.
To activate a TextStyle:
The active TextStyle is used for the Note and SimpleNote commands.
- Click Format > Text Style (or type TextStyle).
In the Options dialog box, the Drafting Styles page opens and Text expands.
- In Style, select a TextStyle.
- Click Activate.
To rename TextStyles:
- Select Format > Text Style (or type TextStyle).
In the Options dialog box, the Drafting Styles page opens and Text expands.
- In Style, select a TextStyle.
- Click Rename.
- Type a new name in the Rename TextStyle dialog box and click OK.
To delete TextStyles:
- Click Format > Text Style (or type TextStyle).
In the Options dialog box, the Drafting Styles page opens and Text expands.
- In Style, select a TextStyle.
- Click Delete.
Note: You cannot delete a TextStyle that is currently used in the drawing.
TextStyles are saved with the drawing file only with a reference to the corresponding font file. They are available any time you open the drawing if the corresponding font file exists in the program folders.
Access
Command: TextStyle
Menu: Format > Text Style
Ribbon: Home > Annotations > Text Style
Creating Notes
The Note command lets you insert text entities.
Notes are formatted text blocks, not singleline text.
Use the Note Formatting pop-up toolbar to apply formatting options as you type text.
When using the Note command, the Columns option for the Note editor lets you organize text into customizable columns.
You can change the size of the columns using the Column options on the Note Formatting toolbar and column grip points.
You can manually break text into columns while typing by pressing Alt + Enter simultaneously.
To create Notes:
- Click Draw > Text > Note (or type Note).
- In the graphics area, specify the first corners of the text box.
- Note: The text box roughly locates the placement for the Text but essentially determines the line length. Text wraps onto the next line if the width is insufficient.
- Specify the opposite corner of the text box or specify an option:
- Angle: Specifies the insertion angle of the Note.
- Height: Specifies the text height used within Note.
- Justify: Specifies the text justification within the Note text box (for example, TL for top left alignment). (Vertical alignment: T = top, M = middle, B = bottom; horizontal alignment: L = left, C = center, R = right).
-
Line spacing: Specifies line spacing used within the Note. Line spacing is the vertical distance between the baseline of a line of text to the baseline of the next line of text. Specify an option:
- At least. Sets the minimum line spacing that is needed to fit the largest font on the line.
- Exactly. Sets fixed line spacing distance or factor. To space all lines evenly within a paragraph, use exact spacing and specify an amount of space that is large enough to fit the largest character in the line.
- Text Style: Specifies a TextStyle.
- Width: Specifies the width of the text box.
-
Columns: Defines the text columns used in the note. You can select one of the following column options:
- Dynamic Columns. Determines the number of columns based on the specified column width and gap. The height can be automatically or manually set.
- Static Columns. Creates a specified number of columns with the specified column width, gap, and height.
- No Columns. Creates the multiline text entity, without columns.
- Type and format the text.
- The cursor
 displays at the current location in the Note.
 - Use the Note Formatting pop-up toolbar as needed (see Using the Note Formatting Pop-up Toolbar).
- Right-click to use the following options:
- Text Import. Inserts text from an ASCII text file (*.txt) or Rich Text Format file (*.rtf).
- Combine paragraphs. Merges selected paragraphs into one.
- Remove Formatting. Lets you Remove Character Formatting, Remove Paragraph Formatting, or Remove All Formatting from the selected text.
-
Paste Special. Lets you Paste without Character Formatting, Paste without Paragraph Formatting, or Paste without Any Formatting from the clipboard. To paste text from the clipboad with formatting, click Paste on the shortcut menu.
Note: Other options on the shortcut menu are available on the Note Formatting pop-up toolbar.
To fill the space indicated by the text box and wrap the text as needed, continue the line entry beyond the visual extents of the text box.
Access
Command: Note
Menu: Draw > Text > Note
Tool Palettes: Draw > Note
Ribbon: Home > Draw > Text > Note
Using the Note Formatting Pop-up Toolbar
Use the Note Formatting pop-up toolbar to edit and format Notes, SmartLeaders, and Leaders.
To open the Note Formatting pop-up toolbar:
- When you type a Note, right-click and click Editor Settings > Show Toolbar.
To format Text using the Note Formatting pop-up toolbar:
- Specify the options as needed:
-
TextStyle
 : Specifies a TextStyle.
 -
Text Font
 : Specifies a typeface using an SHX file or a True Type Font file. SHX files are installed with the system. In addition, you can use any True Type Font installed on your computer .
 -
Text Height
 : Specifies the text height for subsequent or selected text. Select a value from the list or type a value. The text height is the distance from the baseline to the top of a regular uppercase glyph (cap line) and is also known as the cap height.
 -
Bold
 : Specifies bold formatting for subsequent or selected text. Applicable with True Type Fonts only.
 -
Italic
 : Specifies italic formatting for subsequent or selected text. Applicable with True Type Fonts only.
 -
Underline
 : Specifies underline formatting for subsequent or selected text.
 -
Overline
 : Specifies overline formatting for subsequent or selected text.
 -
Strikethrough
 : Specifies strikethrough formatting for subsequent or selected text (draws a line through the middle of the text).
 -
Stack/Unstack
 : Stacks or unstacks selected text representing fractions or tolerances. See Using Stacked Text in Notes for detailed information.
 -
LineColor
 : Specifies the color for subsequent or selected text.
 - Ruler: Displays a ruler at the top of the text box.
-
Insert Field
 : Inserts a Field at the cursor position.
 -
More Options
 : From the menu, select an option:
- Find and Replace: Lets you search for text strings and replace text strings.
- AutoCAPS: Creates new text with uppercase characters. To alter the case of existing text, highlight the text, then right-click, and click Change Case. AutoCAPS does not affect existing text.
- Character Set: Specifies a code page to apply to selected text.
-
Editor Settings: Specify options:
- Always display as WYSIWYG: Controls text display when you edit text. When selected, text is displayed with the size and insertion angle as defined. When cleared, text that is very small, very large, or rotated and difficult to read is displayed at a legible size and horizontally oriented so you can read it easily.
- Show Toolbar: Shows or hides the Note Formatting pop-up toolbar.
- Text Highlight color: Specifies the background color when text is selected.
- Background Mask: Specifies an opaque background color behind the Note.
-
Undo
 : Removes the previous text editing or formatting.
 -
Redo
 : Restores the state prior to issuing Undo.
 -
Copy
 : Copies highlighted text to the clipboard.
 -
Cut
 : Removes the highlighted text and copies the text to the clipboard.
 -
Paste
 : Inserts text from the clipboard at the cursor position.
 -
Uppercase
 : Changes the case of highlighted text to uppercase.
 -
Lowercase
 : Changes the case of highlighted text to lowercase.
 -
Line Spacing
 : Changes the spacing between lines of text. The line space factor applies to the entire Note. From the menu, select an option:
- 1.0, 1.5, 2.0, 2.5, or 3.0: Sets line spacing to the one of these factors.
- Paragraph Options: Displays the Paragraph Options dialog box to specify paragraph justification, indentations, line spacing, and tab settings in one operation.
- Add space before paragraph / Remove space before paragraph: Adds or removes space before a paragraph. Adjust the appropriate value for the space before paragraphs in the Paragraph Options dialog box.
- Add space after paragraph / Remove space after paragraph: Adds or removes space after a paragraph. Adjust the appropriate value for the space after paragraphs in the Paragraph Options dialog box.
-
Paragraph Alignment
 : Changes the horizontal alignment of paragraphs (left-aligned text, right-aligned text, centered text, or justified text, which is aligned evenly along the left and right margins).
 -
Bullets and Lists
 : Makes subsequent or selected text a bulleted list, a numbered list, or a lettered list (uppercase or lowercase), or turns off the list property.
 -
Alignment
 : Sets the justification and alignment in relation to the insertion point of the Note.
 -
Insert Symbol
 : Inserts a symbol (degrees, plus/minus, diameter, and other symbols and characters such as non-breaking spaces) at the cursor position.
 -
Columns
 : Defines the text columns used in the note. From the menu, select an option:
- No columns: Does not create columns.
- Dynamic: Determines the number of columns based on the specified column width and gap. The height of the column can be set automatically or manually.
- Static: Creates a specified number of columns with the specified column width, gap, and height.
- Column Settings: Opens the Column Settings dialog box where you can specify the column number, height, width, gap, and total width.
-
Oblique Angle
 : Specifies the slant of the characters in relation to the text baseline. A positive value for the obliquing angle slants text to the right, a negative value slants text to the left (in the range of 85 to -85).
 -
Tracking Factor
 : Enhances (> 1.0) or reduces (< 1.0) the distances between characters.
 -
Width Factor
 : Specifies the enlargement (> 1.0) or reduction (< 1.0) of the text characters width.
 -
Help
 : Displays this help topic.
 -
OK
 : Finishes Note creation.
Note: Use the NoteOptions command to specify whether you want to edit Notes in place or in a dialog box.
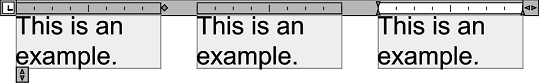
Using the Note Formatting Ruler
Use the Note Formatting ruler to set paragraph indents and tab stops for Notes.
The ruler appears with the Note Formatting pop-up toolbar. It is located at the top of the Note bounding box.
By default, there are no paragraph indents or tab stops on the ruler when you start a new Note.
Paragraph indents and tab stops that you set before you start to enter text apply to the entire Note. When you type or edit, place the pointer in the paragraph to format or select multiple paragraphs to adjust indents and tab stops.
This example shows first line indent, left indent, right indent, and two left tab stops set:

To set paragraph indents:
- Place the pointer in the paragraph to format, or select multiple paragraphs.
- On the Note Formatting ruler, slide indent markers:
- Slide the First Line indent marker (
 ) to the position where you want the first line of a paragraph to begin.
 - Slide the Left indent marker (
 ) from the left to the position where you want the second and all following lines of a paragraph to begin (also referred to as a hanging indent).
 - Slide the Right indent marker (
 ) from the right to the position where you want all lines of a paragraph to end.
- Slide the First Line indent marker (
- The indent settings are maintained for subsequent paragraphs as you type.
To set tab stops:
- Place the pointer in the paragraph to format, or select multiple paragraphs.
- Click the tab selector at the left end of the ruler until it displays the type of tab you want to use:
-
Left (
 ): Sets the start position for subsequent text. The text runs to the right as you type.
 -
Center (
 ): Sets the position for the middle of the text. The text centers on this position as you type.
 -
Right (
 ): Sets the start position for subsequent text. The text runs to the left as you type.
 -
Decimal (
 ): Aligns numbers around a decimal point. Independent of the number of digits, the decimal point is in the same position. You can align numbers around the same type: period, comma, or space.
-
Left (
- Click the ruler at the location you want to place the tab stop.
- As you click or drag tab stops, tooltips show the exact position from the left (in drawing units).
- Repeat the steps above as needed.
Note: When multiple paragraphs are selected, only the tab stops from the first paragraph show on the ruler.
To relocate tab stops:
- Drag existing tab stops left or right along the ruler.
To remove tab stops:
- Drag a tab stop (up or down) off the ruler. When you release the mouse button, the tab stop disappears.
To set paragraph indents and tab stops using the Paragraph Options dialog box:
- Double-click the ruler.
- The Paragraph Options dialog box opens. Note that a tab stop has been created where you clicked.
To resize columns:
- Double-click a note containing columns to edit the text.
- On the Note Formatting ruler, use sliders to adjust the columns:
- To modify the height of text columns, use the Column Height
 slider. If the Manual Height option is active for dynamic columns, a separate height slider is displayed for each column.
 - To modify the width of text columns, use the Column Width
 slider.
 - To modify the note width by modifying the gap between columns, use the Note Width
 slider.
Note: If you do not see the horizontal ruler that runs along the top of the document, click Ruler on the Note Formatting pop-up toolbar.
Formatting Text Paragraphs in Notes
Use the Paragraph Options dialog box to set paragraph alignment, line spacing, indents, and tab stops for Notes.
The dialog box also appears when you edit SmartLeader or Leader text.
This topic discusses:
Setting Paragraph Alignment, Indents, and Line Spacing
To format text paragraphs:
- When editing Notes, place the pointer in the paragraph to format, or select multiple paragraphs.
- Click Line Spacing > Paragraph Options.
- In the dialog box, set paragraph options:
- Under Alignment, set one of the following paragraph alignments:
- None: Sets no alignment for individual paragraphs. Uses the alignment setting for the entire Note entity.
- You set the alignment for entire Notes with the Alignment tool on the Note Formatting pop-up toolbar. This determines justification and alignment in relation to the insertion point of the Note. Paragraph alignment has priority over Note alignment.
-
Left: Aligns the paragraphs to the left (
 ). The left edge of the paragraph is flush with the left margin.
 -
Center: Aligns the paragraphs in the center (
 ).
). -
Right: Aligns the paragraph to the right (
 ). The right edge of the paragraph is flush with the right margin.
 -
Justify: Justifies the paragraph (
 ), which is aligned evenly along the left and right margins. The last text line in a paragraph might appear shorter than the other lines.
- Under Indentation, set paragraph indents (all values are specified in drawing units):
- Left: Sets the left indent for entire paragraphs.
- Right: Sets the right indent for entire paragraphs.
- First line: Sets an extra left indent for the first lines of paragraphs. The value can be positive, negative, or zero relative to the left indent.
- Under Spacing, set paragraph spacing and line spacing options:
- Before: Sets an additional amount of space before paragraphs.
- After: Sets an additional amount of space after paragraphs.
-
Line spacing: Changes the spacing between lines of text. The line space factor applies to selected paragraphs. From the menu, select an option:
- 1.0, 1.5, or 2.0: Sets line spacing to one of these factors.
- At least. Sets the minimum line spacing that is needed to fit the largest font on the line.
- Exactly. Sets a fixed line spacing distance or factor. To space all lines evenly within a paragraph, use exact spacing and specify an amount of space that is large enough to fit the largest character in the line.
- Multiple: Sets line spacing that can be expressed in numbers greater than 1. For example, setting line spacing to 1.2 will increase the space by 20 percent, and setting line spacing to 2 doubles spacing.
-
At: Sets the spacing value to use between individual lines in the selected paragraphs:
- If you select At least or Exactly, specify a value in drawing units.
- If you select Multiple, specify a factor in the range of 0.25 and 4.00.
- Under Tabs, set tab stops:
- See Setting Tab Stops.
- Under Alignment, set one of the following paragraph alignments:
- Click OK.
Use the Note Formatting Ruler to set indents. Double-click the ruler to display the Paragraph Options dialog box.
Setting Tab Stops
To set tab stops:
- When editing Notes, place the pointer in the paragraph to format, or select multiple paragraphs.
- Click Line Spacing > Paragraph Options.
- In the dialog box, under Tabs, set tab stops:
- Select the type of tab stop to use:
-
Left (): Sets the start position for subsequent text. The text runs to the right as you type.
-
Center (): Sets the position for the middle of the text. The text centers on this position as you type.
-
Right (): Sets the start position for subsequent text. The text runs to the left as you type.
-
Decimal (): Aligns numbers around a decimal point. Independent of the number of digits, the decimal point is in the same position. You can align numbers around the same type: period, comma, or space.
-
Left (
- Set the relative Tab stop position from the left margin of the text, measured in drawing units.
- If you selected to use the Decimal tab stop, set a Decimal tab style: Period, Comma, or Space.
- Click Add.
The tab stop appears in the list of tabs.
- Repeat steps a to d as needed.
- Select the type of tab stop to use:
- Click OK.
To delete tab stops:
- When editing Notes, place the pointer in the paragraph to format, or select multiple paragraphs.
- Click Line Spacing > Paragraph Options.
- In the dialog box, under Tabs, select a tab list entry.
- Click Delete.
- – or –
- Click Delete All to clear all tab stops.
- Click OK.
Use the Note Formatting Ruler to set and clear tab stops. Double-click the ruler to display the Paragraph Options dialog box.
Related Commands
Parent Topic
Using Stacked Text in Notes
You can stack text that represents fractions and tolerances in Notes, SmartLeaders, and Leaders.
You can convert numeric characters that are divided by a pound, slash, or carat to text representing fractions and tolerances:
- A pound sign (#) stacks text diagonally, separated by a diagonal line. For example,
 becomes
  .
. - A slash (/) stacks text vertically, separated by a horizontal line. For example,
 becomes
  .
. - A carat (^) stacks text vertically, but not separated by a line. This kind of stacked text usually represents a tolerance. For example,
 becomes
  .
.
Tools to create and modify stacked text include:
- Stack Properties dialog box. Lets you control the text, alignment position, relative scale, and type of stacked text.
- AutoStack Defaults dialog box. Sets defaults to stack text automatically as you type.
- StackOptions command. Sets the alignment and size of stacked text.
- Stack/Unstack tool on the Note Formatting pop-up toolbar. Stacks or unstacks selected text representing fractions or tolerances.
Setting Stack Properties in Notes
Use the Stack Properties dialog box to change the appearance of stacked text in Notes, SmartLeaders, and Leaders.
In annotations, fractions and tolerances are represented by stacked text.
You can control the text, alignment position, relative scale, and type of stacked text.
To set stack properties in Notes:
- Right-click an instance of stacked text and click Stack Properties.
- In the dialog box, click Properties.
- Edit Numerator and Denominator as needed.
- If the stacked text represents a tolerance, enter the plus tolerance in Numerator and the minus tolerance in Denominator.
- In Position, specify the alignment of fractions and tolerances:
- Top. Aligns the baseline of fractions or tolerances with the text baseline.
- Center. Aligns fractions or tolerances in the center. This is the default.
- Bottom. Aligns the top of fractions or tolerances with the cap height (the top line of capital letters).
- Note: Position alignment applies to any stacked text in an entire Note.
- In Scale, specify the size of fractions or tolerances as a percentage of the size of the current TextStyle in the range of 25-125%.
- In Type specify the stacked text type:
- Fraction (Horizontal). Stacks the numerator and denominator separated by a horizontal line.
- Fraction (Diagonal). Stacks the numerator and denominator separated by a diagonal line.
- Tolerance. Stacks the text as a tolerance with no line between the numbers.
- Decimal. Stacks the text as a tolerance with no line between the numbers and aligns the decimal point of both numbers.
- In Preview, view the resulting stacked text.
- To set options to stack text automatically, click AutoStack. See Setting AutoStack Options for Notes.
- Click OK.
You can also use the StackOptions command to set position alignment and the relative size of stacked text. See Setting Stack Options.
Related Commands
Note, SmartLeader, Leader, StackOptions
Parent Topic
Setting AutoStack Defaults for Notes
Use the AutoStack Defaults dialog box to set defaults for automatically stacking text that represents fractions and tolerances in Notes, SmartLeaders, and Leaders.
The dialog box automatically displays as you enter numeric characters that are divided by a pound (#), slash (/), or carat (^) character (see Using Stacked Text in Notes).
To set AutoStack defaults for Notes:
- When editing a Note, enter a fraction or tolerance in the form "x/y", "x#y", or "x^y" (where x is the numerator and y is the denominator) followed by a space or nonnumeric character.
- In the dialog box, select or clear Stack fractions and tolerances automatically to specify whether to stack text automatically as you type.
- Select Remove leading blank to erase blanks between a whole number and a fraction or tolerance.
- In "x/y" stack as, specify whether to convert stacked text in the x/y form (where a slash separates numerator and denominator) to a Decimal fraction or a Horizontal fraction.
- Select Display AutoStack Defaults dialog box automatically when typing, to always display the AutoStack Default dialog box as you type stacked text. Otherwise, the dialog box does not show automatically. and the default settings are used for all subsequent stacked text.
- Click OK.
To set AutoStack defaults for Notes when AutoStack is disabled:
- Right-click an instance of stacked text and click Stack Properties.
- Click AutoStack.
- Set options as described above.
- Click OK.
To set stacked text properties, see Setting Stack Properties in Notes.
Setting Stack Options
Use the StackOptions command to:
- Determine the vertical alignment of stacked text.
- Determine the stacked text fraction height relative to the normal text height.
Stacked text is used to represent fractions and tolerances.
You can apply stacked text when you use the Note, SmartLeader, and Leader commands.
To set stack options:
- Type StackOptions at the command prompt.
- Specify the Align option.
- Specify an option for the vertical alignment of stacked text:
- Top. Aligns the top of fractions or tolerances with the cap height.
- Center. Aligns fractions or tolerances in the center.
- Bottom. Aligns the baseline of fractions or tolerances with the text baseline.
- Specify the Size option.
- Specify the size of stacked text as a percentage of the size of the current TextStyle in the range of 25-125%. The default value is 70.
Access
Command: StackOptions
Related Commands
Parent Topic
Creating SimpleNotes
You can create Text lines of any position, justification, orientation, height, and TextStyle.
Use the SimpleNote Formatting pop-up toolbar to apply formatting options as you type text.
To create SimpleNotes:
- Click Draw > Text > SimpleNote (or type SimpleNote).
- In the graphics area, specify the start position of the first text line.
– or –
Press Enter to continue typing text below the most recently entered text line for a SimpleNote that already exists in the drawing.
– or –
Specify the Settings option (see below).
- Specify the text height.
- Specify the text angle.
The text cursor
displays in the graphics area. - Type a text line.
Use the SimpleNote Formatting pop-up toolbar as needed (see Using the SimpleNote Formatting Pop-up Toolbar).
- Press Enter to type a second line of text. You can enter any number of subsequent lines.
- Press Enter twice to exit the command.
To create SimpleNotes with specified settings:
- Click Draw > Text > SimpleNote (or type SimpleNote).
- Specify the Settings option.
- In the dialog box, under Insertion orientation, set the position and alignment of the text lines related to the insertion point.
- Under Options, set:
-
Style. Defines a TextStyle. Click TextStyle
 to create a new TextStyle.
 - Height. Specifies the text size.
- Angle. Specifies the insertion angle.
-
Style. Defines a TextStyle. Click TextStyle
- Click OK.
- In the graphics area, specify the start position of the first text line.
The text cursor
displays in the graphics area. - Type text to add to the drawing.
Use the SimpleNote Formatting pop-up toolbar as needed (see Using the SimpleNote Formatting Pop-up Toolbar).
Note: Use the NoteOptions command to specify whether you want to edit SimpleNotes in place or in a dialog box.
Access
Command: SimpleNote
Menu: Draw > Text > SimpleNote
Ribbon: Home > Annotations > Text > SimpleNote
Annotate > Text > (Flyout) SimpleNote
Using the SimpleNote Formatting Pop-up Toolbar
Use the SimpleNote Formatting pop-up toolbar to edit and format SimpleNotes.
Unlike with Notes, formatting options apply to the entire SimpleNote (with exemption of the Copy, Cut, Uppercase, and Lowercase options which format the highlighted text).
To open the SimpleNote Formatting pop-up toolbar:
- When you type a SimpleNote, right-click and click Editor Settings > Show Toolbar.
To format Text using the SimpleNote Formatting pop-up toolbar:
- Specify the options as needed:
-
TextStyle : Specifies a TextStyle.
-
Text Height
 : Specifies the height of the text lines.
 -
Text Angle
 : Specifies the insertion angle of the text lines.
 -
LineColor : Specifies the color of the SimpleNote.
-
Insert Field : Inserts a Field at the cursor position.
-
More Options : From the menu, select an option:
- Find and Replace: Lets you search for text strings and replace text strings.
-
Editor Settings: Specify options:
-
Always display as WYSIWYG: Controls text display when you edit text.
- When selected, text is displayed with the size and insertion angle as defined.
- When cleared, text that is very small, very large, or rotated and difficult to read is displayed at a legible size and horizontally oriented so you can read it easily.
- Show Toolbar: Shows or hides the SimpleNote Formatting pop-up toolbar.
- Text Highlight color: Specifies the background color when text is selected.
-
Always display as WYSIWYG: Controls text display when you edit text.
-
Undo : Removes the previous text editing or formatting.
-
Redo : Restores the state prior to issuing Undo.
-
Copy : Copies highlighted text to the clipboard.
-
Cut : Removes the highlighted text and copies the text to the clipboard.
-
Paste : Inserts text from the clipboard.
-
Uppercase : Changes the case of highlighted text to uppercase.
-
Lowercase : Changes the case of highlighted text to lowecase.
-
Alignment : Sets the justification and alignment in relation to the insertion point of the SimpleNote.
-
Oblique Angle : Specifies the slant of the characters in relation to the text baseline.
-
Width Factor : Specifies the enlargement (> 1.0) or reduction (< 1.0) of the text characters width.
-
Help : Displays this help topic.
-
OK : Finishes SimpleNote creation.
Note: Use the NoteOptions command to specify whether you want to edit SimpleNotes in place or in a dialog box.
Editing Annotations
The EditAnnotation command lets you edit different types of Text entities: Notes, SimpleNotes, Dimension text, Leader annotations, BlockAttributes, and BlockAttribute definitions.
You can use the EditAnnotation command to edit element labels in the Block editor.
To edit text or annotations:
- Click Modify > Entity > Annotation (or type EditAnnotation).
- In the graphics area, select a Text entity.
- Depending on the type of Text or annotation entity you selected, the command displays the appropriate dialog box for editing. If the selected entity:
- was created using the SimpleNote command, edit the text in-place using the SimpleNote Formatting pop-up toolbar for formatting.
- was created using the Note command, edit the text in-place using the Note Formatting pop-up toolbar for formatting.
- is an attribute definition created using the MakeBlockAttribute command, edit the entity in the Edit BlockAttribute dialog box.
- is a Block with attributes that you can edit with the EditBlockAttribute command, edit the entity in the Edit BlockAttribute Values dialog box.
- is a Leader created using the Leader or SmartLeader commands, edit the entity in the Edit Note dialog box.
- is a Dimension, edit the Dimension text in the Edit Note dialog box.
- is the label of a CustomBlock, edit the label text in-place.
Use the NoteOptions command to determine whether to edit Notes and SimpleNotes in-place or in a dialog box.
Access
Command: EditAnnotation
Menu: Modify > Entity > Annotation
Ribbon: Home > Modify > (Flyout) Edit Annotation
Setting Note Editing Options
Use the NoteOptions command to set preferences for text editing with the Note and SimpleNote commands.
The settings for Notes also apply to multiline BlockAttributes and multiline BlockAttribute definitions.
You can:
- Determine whether you want to edit in place or in a dialog box
- Set options for text display when you type
- Specify a sample string to preview TextStyle and formatting when you start text editing
To set text editing options for Notes:
- Type NoteOptions at the command prompt.
- Specify the Note Editor option.
- Specify an option:
- In-place. Specifies that you type Notes in-place in the graphics area and use the Note Formatting pop-up toolbar to format text. This is the default mode.
- Dialog box. Specifies that you type Notes in a dialog box with the formatting options at the top. Dialog box based editing is applied especially if you need to place or modify rotated text that is difficult to view when typing in-place.
- External editor. Specifies that you create Notes in an external text editor or wordprocessor (such as Notepad). Text formatting from an external editor is not preserved.
- If you selected External editor, specify the path and the name of an executable file (such as Notepad). Type ~ (tilde) to open the Browse for file dialog box.
To set text editing options for SimpleNotes:
- Type NoteOptions at the command prompt.
- Specify the SimpleNote Editor option.
- Specify an option:
- Dialog box. Specifies that you type SimpleNotes in a dialog box with the formatting options at the top.
- In-place. Specifies that you type SimpleNotes in-place in the graphics area and use the SimpleNote Formatting pop-up toolbar to format text.
- Advanced. Specifies that you create SimpleNotes in-place, additionally providing the advanced option to click elsewhere in the graphics area to specify a new start point for subsequent text within the running command. This is the default mode.
To set display options for text editing:
- Type NoteOptions at the command prompt.
- Specify the Display Options option.
- Specify an option:
- As defined. When editing text in-place, it is displayed as defined even though it is too small to read or rotated about an angle that makes it difficult to read.
- Easy readable. Temporarily enlarges very small text and rotates it if necessary for easy viewing during in-place text editing.
To set a sample string for editing preview:
- Type NoteOptions at the command prompt.
- Specify the Sample Text option.
- Type a sample text string such as "abc".
- Enter a period (".") to display no sample text.
- The sample string will display in the current TextStyle, text size, and formatting at the cursor location when you start the Note command.
Access
Command: NoteOptions
Inserting Fields
Additionally, the Field command lets you include drawing sheet set information as field in any text entity from your drawing.
The Field dialog box includes field codes for specific drawing sheet set information such as drawing sheet number, description, or revision date. Custom properties that you defined for a drawing sheet or for the entire drawing sheet set are also available and you can insert them as fields.
You can access the Field dialog box when editing annotations, BlockAttributes, and table cells.
Tip: Create drawing sheets and use fields to automate the information displayed in title blocks, view labels, and callout blocks.
Fields are updated automatically when you save, print, or rebuild drawings.
You can update Fields in annotations manually with the RebuildField command.
To insert Fields:
- Do one of the following:
- On the ribbon, click Insert > Data > Field.
- On the menu, click Insert > Field.
- Type Field.
- In the dialog box, specify the Field to insert:
- Category: Delimits the field names in the Name list by category, for example Date/Time or Document.
- Name: Determines the Field to insert.
- Format: Specifies the format for the Field text, for example, lower or upper case for a character string or the date format for a date field.
- Click OK
 .
. - In the graphics area, specify the insertion point of the Field.
Note: The Field command uses the current TextStyle and text size.
Use the SetFieldDisplay command to specify whether Fields display with a gray background in annotations.
To use a field to display entity properties in a text entity:
- In the graphics area, double-click the text entity to switch to editing mode.
- Place the pointer where you want to insert the field.
- Right-click and select Insert Field from the context menu.
- In the Field dialog box, do the following:
- In Category, select All.
- In Name, specify Entity.
- Click Specify entity
 , select the entity in the graphics area, and press Enter to complete the selection.
 - In Property, specify the property whose value you want to display in the field.
- In Format, specify a format for the field text. Optionally, you can specify Additional Format options.
The Preview area displays the value of the specified property.
- Click OK.
Using Drawing Sheet Set Fields
You can create drawing sheets and use fields to automate the information displayed in title blocks, view labels, and callout blocks. The Field command lets you include drawing sheet set information as field in any text entity from your drawing. As the drawing sheet and drawing sheet set information changes, the data displayed in the title block, view labels, and callout blocks is always up-to-date.
You can create the field as a hyperlink to a drawing sheet or view. Later, when you move the corresponding drawing sheets and views in the Sheet Set Manager, the associated hyperlinks will jump to the correct location.
The Field dialog box includes field codes for specific drawing sheet set information such as drawing sheet number, description, or revision date. Custom properties that you defined for a drawing sheet or for the entire drawing sheet set are also available and you can insert them as fields. Specific field types are available in the DrawingSheetSet category.
- Fields for which the name starts with CurrentDrawingSheet lets you use properties related to the current drawing sheet.
- Field for which the name starts with CurrentDrawingSheetSet lets you use properties related to the current drawing sheet set.
- DrawingSheetSet. Lets you include an item of the specified drawing sheet set into a field.
- DrawingSheetSetPlaceholder. Lets you insert a placeholder in a callout block or in a view label. For example, you can define block attributes to display information such as view title or drawing sheet number in callout blocks specified for a drawing sheet set. When you use the callout block in a drawing sheet from the Sheet Set Manager, placeholders update automatically to display the correct values.
- DrawingSheetView. Lets you include an item of the specified drawing sheet set into a field.
Note: To update the value in a drawing sheet set field, use the RebuildField command.
To insert a drawing sheet set placeholder field:
You can define a block and use it as callout block or label block in a drawing shet set.
- Open the Block Attribute Definition dialog box for the callout block or label block that you use with the Drawing Sheet Set Manager.
- In Name, type a name for the field.
- In the right of the Default value, click Insert Field.
- In the Field dialog box, in Category, select DrawingSheetSet.
The Name list displays all drawing sheet set properties.
- In Name, select DrawingSheetSetPlaceholder.
- In Placeholder type, select the type of field.
- In the Format list, specify the format.
- Optionally, click Associate hyperlink to create the field as a hyperlink to a drawing sheet or view. Associating a hyperlink lets you click on the inserted callout block to open the associated drawing sheet or view.
Note: Associate hyperlink is not available for the ViewportScale and Custom fields.
- Click OK to close the Field dialog box.
The placeholder field displays its name. For example, DrawingSheetTitle.
- Click OK to close the Block Attribute dialog box.
- In the graphics area, specify the location of the field text.
Using QR Code and Link Fields
The Field command lets you include QR codes and the as field on your drawing.
The Field dialog box includes field codes for embedding QR codes and links into your drawing.
Common data, such as the name of the users who have access to the file and last date when a user added a comment or modified the drawing are also available and you can use them in fields, text entities and table cells.
Specific field codes are available in the CloudDocument category.
- Fields for which the name starts with ViewOnlyLink let you embed a link or QR code for opening the drawing in view-only mode.
- Fields for which the name starts with DownloadLink let you embed a link or QR code for downloading the drawing.
To insert a QR code as field:
- Do one of the following:
- On the ribbon, click Insert > Data > Field.
- On the menu, click Insert > Field.
- Type Field.
- In Category, select CloudDocument.
- In Name, specify the version of the drawing to link with the QR code. Available options let you download the drawing or open it in view-only mode.
- In Format, specify QR code.
- The following options are available only if the drawing is stored on the Cloud Storage
- DownloadLinkOfCurrentVersionDrawing. Lets you insert a QR code associated with the version of the drawing where the QR code is created.
- DownloadLinkOfLatestVersionDrawing. Lets you insert a QR code associated with the latest version of the drawing.
- DownloadLinkOfPrintedVersionDrawing. Lets you insert a QR code associated with the drawing that has been printed.
- ViewLinkOfCurrentVersionDrawing. Lets you insert a QR code for opening the version of the drawing where the QR code or the link is created, in view-only mode.
- ViewLinkOfLatestVersionDrawing. Lets you insert a QR code for opening the latest version of the drawing in view-only mode.
- ViewLinkOfPrintedVersionDrawing. Lets you insert a QR code for opening the version of the drawing that has been printed in view-only mode.
- In Description, specify a description of the linked drawing or other additional information. When you scan the QR code, the description displays at the bottom.
- In Custom property name, select the custom property to include as field.
- Click OK.
Access
Command: Field
Menu: Insert > Field
Ribbon: Insert > Data > (Flyout) Field
Updating Field Information
You can manually update Fields in annotations in the graphics area.
To update Fields:
- Do one of the following:
- On the ribbon, click Insert > Data > Rebuild Fields.
- On the menu, click Insert > Rebuild Field.
- Type RebuildField.
- In the graphics area, specify annotations.
- Press Enter.
Fields embedded in annotations are updated.
Tip: Alternatively, you can right-click annotations and from the context menu, select Update Field.
Access
Command: RebuildField
Menu: Insert > Rebuild Fields
Ribbon: Insert > Data > (Flyout) Rebuild Fields
Setting the Background for Fields
You can specify whether Fields display with a gray background in annotations.
To set the background for Fields:
- Type SetFieldDisplay at the command prompt.
- Specify the Yes or No option to specify whether Fields display with a gray background.
Access
Command: SetFieldDisplay
Finding and Replacing Text
You can browse the drawing to find Text and you can find and replace Text.
To find and replace Text:
- Click Edit > Find (or type Find).
The Find and Replace dialog box opens.
- In Find what, type the Text to find.
- In Search in, specify where to find the Text. You can browse:
- on the Active Sheet/Area
- in the Entire drawing
- in a specified Selection set. Click Select in graphics area
 and click in the graphics area to add entities. The dialog box closes temporarily until you specify the entities to form a selection set.
- In Replace with, type the Text to replace the search string. Leave Replace with empty if you want to find Text but not replace it.
- Click Options to specify the entity types to include in the search and set search options.
The Find and Replace Options dialog box opens:
- In Search for text in select or clear BlockAttribute values, Dimensions, Notes and SimpleNotes, Hyperlink addresses, Hyperlink text, Tables, and Externally referenced drawings.
- Specify whether to Match case, Find whole words only, and Use wildcards.
- In Search Results:
- click Find, then Find next, to search for the specified Text
In the context area text blocks or text lines display the corresponding content of the found Text.
The Summary area displays the number of matches found or changed.
- click Replace to replace all appearances of the found Text
- click Replace All to replace all found Text locations
- click Select All to create a selection set from all the entities that contain the text displayed in the Search result list.
- click Zoom to to zoom to the current Text location in the graphics area
- click Find, then Find next, to search for the specified Text
- Click Close.
Access
Command: Find
Menu: Edit > Find
Checking Spelling
[Windows® versions only]
You can check the spelling of Text in drawings.
To check the spelling as you type, on the Edit Note toolbar, click Other Options > Editor Settings > Spellcheck.
To check spelling:
- Type SpellCheck at the command prompt.
- In the graphics area, select the Text entities to check and press Enter.
- The Spell Check dialog box appears if the software finds a spelling mistake:
- Under Current word, the dialog box displays the word in doubt.
- Under Context, the dialog box displays the Text line or portion of the Text line.
- Under Suggestions, corrections are proposed.
- You can:
- Ignore the suggestion for the current appearance of the word in doubt.
- Ignore All the suggestions for all appearances of the word in doubt.
- Change the current word to the word you select in Suggestions.
- Change All appearances of the misspelled words to the word you select in Suggestions.
- Add the word in doubt to the dictionary.
- Look Up a word to find synonyms.
- Change Dictionary to specify another language for spell checking.
- Click Close.
Access
Command: SpellCheck
Checking Spelling as You Type
[Windows® and Mac® versions only]
You can check the spelling of text entities as you type, both for SimpleNotes and for Notes.
Several dictionaries are available in different languages. The spell checking tool identifies misspelled words based on the specified dictionary and underlines them with a red line.
To check the spelling as you type:
- Do one of the following:
- On the Edit Note toolbar, click Other Options > Editor Settings.
- Right-click a misspelled word and select Editor Settings from the context menu.
- Enable Spellcheck.
To turn off spell checking, clear the Spellcheck option.
To set spellcheck options:
- Do one of the following:
- On the Edit Note toolbar, click Other Options > Editor Settings.
- Right-click a misspelled word and select Editor Settings from the context menu.
- Select Spellcheck Options.
- In the Spellcheck Options dialog box, specify the text options to take into account when checking the spelling.
To set the dictionary:
- Do one of the following:
- On the Edit Note toolbar, click Other Options > Editor Settings > Dictionaries.
- Right-click a misspelled word and select Editor Settings from the context menu.
- In the Dictionaries dialog box, specify the dictionary.
Working with Tables
Tables are drawing entities that contain data in rows and columns. You can include in Tables various data, such as text, Blocks, numeric data, and formulas. Additionally, fields let you include information from the drawing.
Use Tables for title blocks, part lists, legends, calculations, or annotations, for example.
Tables have three types of cells: title, head, and data. When you create a table, the title cell is in editing mode and you can type text.
At any time, you can modify the size of table rows and columns using grip points.
TableStyles determine the structure and appearance of Tables.
All text fields are Text entities that you can edit and format using the Edit Note text editor.
You can use existing data from Microsoft Excel XLSX files when you create tables within a drawing. A so called data link lets you link the table to an entire spreadsheet or only to a cell or cell range.
Commands to work with Tables include:
- Creating Tables
- Modifying Tables
- Using Formulas in Table Cells
- Exporting Tables
- Linking Tables to External Data
Creating Tables
You can create Tables in drawings.
To create Tables:
- Click Draw > Table (or type Table).
- In the Insert Table dialog box, under TableStyle, select a TableStyle or click View table styles
 to create or edit a TableStyle.
An image of the chosen TableStyle displays under Preview.
- Under Insertion method, select:
-
Set corners: Lets you define the corners of the Table in the graphics area.
When selected, set the Number or Height (number of text lines allowed per row) of Rows and the Number or Width (in drawing units) of Columns.
-
Set position: Lets you click a point in the graphics area.
When selected, set the Number and Height of Rows and the Number and Width of Columns.
-
Set corners: Lets you define the corners of the Table in the graphics area.
- In Cell styles, set:
- First row: Select a cell style (Title, Header, or Data).
- Second row: Select a cell style (Title, Header, or Data).
-
All other rows: Select a cell style (Title, Header, or Data).
Typically use Title for the first row, Header for the second row, and Data for all other rows in the table.
- Click OK.
- In the graphics area, specify the insertion point.
- In the dialog box, edit the Table title.
- Press Tab to proceed to the next table cell, then type text.
- Click OK.
Use the EditTable command to enter or modify text for Table cells.
Access
Command: Table
Menu: Draw > Table
Ribbon: Annotate > Table > Insert
Tool Palettes: Draw > Insert
Modifying Tables
At any time, you can modify an existing table.
-
Modify the size of table rows and columns
Use grip points or the Properties palette to modify the hight and width of rows and columns. Modifying with grip points is a direct and interactive way to manipulate tables. In the graphics area, you select a table row or column, or the entire table. You use grip points to drag defining points of entities to new positions (stretching), or to move, rotate, scale, mirror, or copy entire entities.
-
Modify table appearance
TableStyles determine the structure and appearance of Tables.
-
Modify table cells
Use grip points to extend the cell or its row or column.
-
Split tables
Use the triangular grip point or the Properties palette to break a table into main and secondary table parts.
-
Insert or remove rows and columns, merge and unmerge cells
Additional options let you perform various operations with table rows, columns and cells. With a cell selected, right-click to access the context menu.
-
Edit text in tables
Use the EditTable command to edit text in tables. You can also edit table text in place using a pop-up toolbar which provides enhanced formatting options.
- Adding Blocks to a table
With a cell range selected, use Ctrl + Y or F4 to repeat the last action.
All text fields are Text entities that you can edit and format using the Edit Note text editor.
This section discusses:
- Editing Text in Tables
- Editing Tables and Table Cells
- Copying Properties Between Table Cells
- Splitting Tables
- Managing TableStyles
Editing Tables and Table Cells
You can insert, delete, merge, or resize cells, rows, and columns in tables. You can modify the cells in place or use the EditTableCell command to modify table cells from the command window.
Options provided by the EditTableCell command correspond to some tools available on the Table contextual ribbon.
If you select a table or a range of cells in the graphics area and the ribbon is active, the Table contextual ribbon tab appears. The contextual ribbon tab groups options and tools for modifying tables. For example, tools for inserting and deleting rows and columns, merging cells, change the appearance of cell borders, modifying the formatting.
Grip points provide additional means to modify tables. When you click inside a cell to select it, grip points appear on the cell border. You can select one or more cells or an entire row or column.
Grip points displayed on the middle of the cell border let you resize table cells. Drag grip points to adjust the cell height and width.
A special grip point in the lower right corner of the cell lets you autofill incremental values in the table.
To select a range of cells, click and drag over several cells. Alternatively, hold down Shift and click inside another cell to select all the cells between them.
If you select a table or a range of cells in the graphics area and the ribbon is active, the Table contextual ribbon tab appears. The contextual ribbon tab groups options and tools for modifying tables. For example, tools for inserting and deleting rows and columns, merging cells, change the appearance of cell borders, modifying the formatting.
With a range of cell selected, use Ctrl + Y or F4 to repeat the last action.
To resize table cells:
- Select one or more table cells to edit them in place:
- Click a table cell
– or –
-
Shift + click multiple table cells
– or –
- Click a row or column header to select entire rows or columns
The selected cell(s) are highlighted and display with grips. Column and row headers appear.
The editing tools appear.

- Click a table cell
- Use tools on the Edit Table Cells toolbar pop-up toolbar to modify the table
- According to the type of user interface, do one of the following:
- Use tools on the Edit Table Cells toolbar pop-up toolbar to modify the table.
- Use the tools on the Table ribbon tab to modify the table.
- Use the tools on the Table contextual ribbon tab to modify the table.
- Use the left or right cell grip to adjust the column width of the selected column and the top and bottom cell grip to adjust the height of the selected rows.
To edit text in table cells:
- Select one or more table cells to edit them in place:
- Click a table cell
– or –
-
Shift + click multiple table cells
– or –
- Click a row or column header to select entire rows or columns
The selected cell(s) are highlighted and display with grips. The editing tools appear.
- Click a table cell
- Use tools on the Edit Table Cells toolbar pop-up toolbar to modify the table
- According to the type of user interface, do one of the following:
- Use tools on the Edit Table Cells toolbar pop-up toolbar to modify the table.
- Use the tools on the Table ribbon tab to modify the table.
- Use the tools on the Table contextual ribbon tab to modify the table.
- Right-click selected cells to access additional options:
- Edit Text. Opens the Note Formatting pop-up toolbar to edit table cell text.
- Delete All Contents. Deletes text in the selected cell(s).
- Properties. Lets you modify cell properties in the Properties palette.
- Click outside the table to finish editing.
To use the same text in multiple table cells, select the cells, then enter the text in the Data text box of the Content area of the Properties palette. In this area, you can also apply the same text color, text height, and TextStyle in multiple table cells.
To modify the border line appearance:
- Select one or more table cells to edit them in place:
- Click a table cell
– or –
-
Shift + click multiple table cells
– or –
- Click a row or column header to select entire rows or columns
The selected cell(s) are highlighted and display with grips.
The editing tools appear.
- Click a table cell
- Do one of the following:
- On the Edit Table Cells toolbar, click Cell Format
 .
. - On the ribbon, select Table > Cell > Cell Format.
- On the Edit Table Cells toolbar, click Cell Format
- On the Edit Table Cells toolbar, click Cell Format .
- In the Cell Format dialog box, do the following:
- LineColor. Select a color for the specified borders.
- LineStyle. Select a LineStyle for the specified borders.
- LineWeight. Select a LineWeight for the specified borders.
- Apply to. Applies the selected LineColor, LineStyle and LineWeight to the selected border.
Note: Use ByBlock to apply line properties defined in the TableStyle.
With a range of cells selected, use Ctrl + Y to open the Cell Format dialog box.
To edit table cells with the EditTableCell command:
- Type EditTableCell at the command prompt.
- Specify a table cell.
- Specify a cell or a range of cells in the format An or An:An, where A stands for column indicator(s) and n stands for row number(s).
For example, C3 or B2:D5.
- Use command options (Insert, Remove, Size, Merge, and Unmerge) and sub-options to modify the table.
The options correspond to the Edit Table Cells pop-up toolbar options (see above).
Options for working with the cell content:
- Content. Lets you lock and unlock specified cells for editing.
- Datatype. Lets you specify the data type.
- Formula. Lets you specify a formula.
- InsertBlock. Opens the Insert Block in Table Cell dialog box and lets you insert a Block in the specified cell.
- InsertField. Opens the Field dialog box and lets you insert a field in the specified cell.
Options for formatting data:
- Format. Lets you align the cell content and change the background color. Additionally, you can lock and unlock the specified cells for changing the format.
- ContentFormat. Lets you lock and unlock specified cells to protect them from accidentally changing the format while modifying the content.
- Specify the Exit option.
To edit table presentation using EntityGrips:
- Click a table guideline.
- The EntityGrips appear.
- Select EntityGrips to modify the table:
-
EntityGrip Location Description Upper left corner Moves the table. Upper right corner Stretches the table horizontally. Lower left corner Stretches the table vertically. Lower right corner Stretches the table horizontally and vertically. Lower midpoint Breaks the table. Top of columns Adjusts the column widths. - Click outside the table to finish modifying the table’s appearance.
Click table grips twice to move, rotate, scale, or copy entire tables (see Modifying with EntityGrips).
Access
Command: EditTableCell
Menu: Modify > Entities > Table Cells
Copying Properties Between Table Cells
The CellPropertyPainter command applies the properties of one table cell to specified cells in the same table, or in other tables.
You can copy and paste various properties between table cells, including the following:
- Cell style
- Alignment
- Background Color
- Border Syle
- Margins
- Locking Status
You cannot apply properties from the source cell to locked cells.
To copy properties between table cells:
- Click inside of a cell to select it.
- On the Table contextual ribbon, click Cell > Match Cell Properties (or type CellPropertyPainter).
- Specify the table cells to apply properties to.
You can specify as many cells as necessary.
- Press Esc or Enter to exit the command.
Access
Command: CellPropertyPainter
Ribbon: Table > Cell > Match Cell Properties
Splitting Tables
In practice, there are situations when tables are longer than the sheet.
Scaling the table might be a solution to fit the table on the sheet. However, the result might contain text that is difficult to read, due to the small size of the characters. Breaking the table could be a more suitable solution.
Use the triangular grip point or the Properties palette to break a table into main and secondary table parts.
Further options in the Properties palette let you:
- Specify where to place the secondary tables
- Repeat column labels on secondary tables
- Manually move secondary tables using grip points.
To break a table using grip points:
- In the graphics area, click a table guideline to select the table.
- Click the triangular grip point at the lower midpoint of the table.
- Drag to position the grip point higher on the screen, within the table.
The table rows appear on the right. The distance defined by moving the grip point is the new size of the table. As you add new rows to the table, once the table reaches the defined height, overflows on the next table.
Alternatively, you can break the table using the Properties palette: in Table Breaks, select Yes.
To display column labels on secondary tables:
- In the graphics area, click a table guideline to select the table.
- Right-click and select Properties from the context menu.
- In the Properties palette, do the following:
- In Table Breaks, select Yes.
- In Repeat top labels, select Yes.
Note: If column labels are on the last line of the table, select Yes for Repeat bottom labels.
Managing TableStyles
You can create, modify, and delete TableStyles. You can also set a TableStyle as the active one.
To create TableStyles:
- Click Format > Table Style (or type TableStyle).
- In the Options dialog box, the Drafting Styles page opens, and Table expands.
- Click New.
- In the Create new TableStyle dialog box, type a new name and click OK.
- The new TableStyle appears in Style.
To modify TableStyles:
- Click Format > Table Style (or type TableStyle).
- In the Options dialog box, the Drafting Styles page opens, and Table expands.
- In Filter, select an option:
- All styles. Lists all of the styles defined in the drawing.
- Styles in drawing. Lists only the styles that are referenced by Tables in the drawing.
- In Style, select a TableStyle.
- Under Cell style settings, in Contents, select the cell type to edit (Data, Head, or Title).
- Under Display, set:
- Background color: Sets the background color for the table.
- Align. Sets the justification and alignment of the text in the cells.
- Under Text, set:
- Color: Sets the text color.
-
Style: Contains all TextStyles defined in the drawing. Click Display text styles to define TextStyles for subsequent use.
- Height: Sets the text size.
- Under Borders, set:
- Color: Sets the border color.
- Weight: Sets the border weight.
- Apply to: Sets the specified Color and Weight to the border(s) you select.
- Under Cell margins, type a value for the Horizontal and Vertical cell margins (in drawing units).
- In Table header orientation select an item to specify whether the table is generated downward or upward from the insertion point.
- The modifications will reflect in tables using that style.
To set a TableStyle as active:
- Click Format > Table Style (or type TableStyle).
- In the Options dialog box, the Drafting Styles page opens, and Table expands.
- In Style, select a TableStyle.
- Click Activate.
- A
 displays beside the active TableStyle.
To rename TableStyles:
- Click Format > Table Style (or type TableStyle).
- In the Options dialog box, the Drafting Styles page opens, and Table expands.
- In Style, select a TableStyle.
- Click Rename.
- In the Rename TableStyle dialog box, type a new name for the TableStyle.
- Click OK.
To delete TableStyles:
You can delete TableStyles if they are not referenced by a Table in the drawing.
You can also use the Clean command to remove unreferenced TableStyles.
You cannot delete the Standard style.
- Click Format > Table Style (or type TableStyle).
- In the Options dialog box, the Drafting Styles page opens, and Table expands.
- In Style, select a TableStyle.
- Click Delete.
- Click Yes to confirm the deletion.
Access
Command: TableStyle
Menu: Format >Table Style
Ribbon: Annotate > Table > Table Style
Working with Text, Fields, and Blocks in Tables
You can include in Tables various data, such as text, Blocks, numeric data, and formulas. Additionally, fields let you include information from the drawing.
This chapter discusses:
- Editing Text in Tables
- Adding Blocks to a Tables
- Managing Table Cell Content
- Using Formulas in Table Cells
- Filling Data Automatically in Table Cells
Editing Text in Tables
When you create a table, the title cell is in editing mode and you can type text. Texts within table cells are Text entities that you can edit and format using the Edit Note text editor.
Use the EditTable command to edit text in tables. You can also edit table text in place using a pop-up toolbar which provides enhanced formatting options.
Double-clicking a table cell switches the cell to editing mode. Click Tab to proceed to the next table cell, or Shift+Tab to proceed to the previous table cell.
To edit text in tables:
- Type EditTable at the command prompt.
- In the graphics area, click the text of the cell to edit.
- Type and edit the text and use the formatting options of the Note Formatting pop-up toolbar. Within the cell, you can use the arrow keys to move the cursor.
Click Tab to proceed to the next table cell, or Shift+Tab to proceed to the previous table cell.
- Click OK on the toolbar.
To edit table text in place:
- In the graphics area, double-click the table cell to edit.
- Type and edit the text and use the formatting options of the Note Formatting pop-up toolbar. Within the cell, you can use the arrow keys to move the cursor.
- Click OK on the toolbar.
To modify the TextStyle, text height, border line appearance, or the table cell background color, use the TableStyle command. To insert, delete, merge, or resize rows and columns in tables, use the EditTableCell command.
Access
Command: EditTable
Menu: Modify > Entity > Table Text, Table Cell
Adding Blocks to a Table
Along with text, fields, or numerical data, table cells can include multiple Blocks.
You can insert Blocks into a table from the cell context menu. Alternatively, use the TInsert command to insert Blocks in a specified cell.
The Table contextual ribbon tab groups options and tools for working with tables.
You can insert:
- Blocks defined in the active drawing
- Blocks defined in external drawing files
When you add a Block into a table cell, you can specify whether the Block will be scaled to fit the cell size or the cell will resize to fit the Block size. If the cell contains multiple Blocks, use the ManageCellContent command to modify the content display.
To insert a Block in a table cell:
- In the graphics area, select the cell where you want to insert the Block.
If the ribbon is active, the Table contextual ribbon tab appears. The contextual ribbon tab groups options and tools for working with tables.
- Right-click and select Insert Block from the context menu.
- In the dialog box, in Name, select a Block. Click Browse to locate an external drawing.
The preview area displays the selected Block.
Note: The sign in the lower right corner of the Preview area identifies the Block:
 Dynamic Block
CB CustomBlock
- Under Scale, specify the scale for the Block reference. A scale factor of:
- 1: Inserts the Block at its original size.
- Less than 1: Reduces the size to the percentage of the original size specified by the factor.
- Greater than 1: Increases the size.
- Optionally, you can enable AutoFit option to automatically scale the Block to fit in the specified cell.
- In Angle, specify a value to set the rotation angle in the cell.
- Under Insertion orientation, specify alignment for the Block within the table cell.
- Click OK.
The Block appears in the specified cell.
Access
Command: TInsert
Contextual Ribbon: Table > Insert Contents > Insert Block
Managing Table Cell Content
Use the ManageCellContents command to better fit Blocks and cell contents in table cells.
You can do the following:
- Change the order of the Blocks and cell contents
- Delete Blocks and contents from a cell
- Increase or decrease the spacing between Blocks and cell content
To manage cells content in a table:
- Type ManageCellContents at the command prompt.
- In the graphics area, specify the cell that contains Blocks and Text.
- Specify an option:
- Cell contents. Lets you modify the content of the cell.
- Change the order
- Delete existing Blocks
-
Layout mode. Specify an option:
- Flow. Displays Blocks at their default position, one after another.
- Stacked horizontal. Automatically scales the Blocks to fit on one line in the table cell.
- Stacked vertical. Automatically scales the Blocks to fit the column height in the table cell.
- Spacing. Lets you specify the distance between Blocks within the table cell.
- Exit. Ends the command.
- Press Enter.
Access
Command: ManageCellContents
Using Formulas in Table Cells
In tables, you can use formulas in cells that are calculated based on the values from other cells. The cell that contains a formula displays the calculated value.
If the formula returns an error, the cell displays “####”.
A formula is an expression that calculates a value based on the values from the cells specified in the expression.
The following functions are available and can be used in formulas:
- Sum. Calculates the sum of the values from the defined cells.
- Average. Calculates the average of the values from the defined cells.
- Count. Counts cells with numbers.
Additionally, you can insert expressions to calculate results based on the values from the specified cells and range of cells.
You can automatically apply Sum, Average, and Count as Auto Formula to a column or a row of cells. Auto Formula tools automatically detect the range and insert the calculated result.
A formula must start always with the equal sign (=) and can contain the following signs:
| Sign | Description |
|---|---|
| + | Plus |
| – | Minus |
| * | Times |
| / | Divided by |
| ^ | Exponent |
| () | Parentheses |
Specifying Cells Within Formulas
You can specify cells and ranges of cells within a formula by selecting them or by referring to them using the column and row labels.
- To refer to a cell in a formula, use its column letter and row number.
Example: A1, D2, C3
- To specify a range of cells in a formula, use the first and the last cells of the range separated with a colon “:”.
Example: A2:B4
- To apply a formula to multiple ranges, use the function followed by one or more ranges within the table in parenthesis separated by commas.
Example: Sum (A2:B2, A3:B3)
If the cell is part of merged cells, use the cell number of the top left cell. If the merged cells contain values, only the value from the top left cell is visible after merging the cells.
Example:
The following table has a cell range A1:G8.
- Merge the cells from A3 through C4.
After merging the cells, A3 identifies the merged cell that you can use in all formulas. The new cell displays the value that was previously in A3.
Changing the Cell Data Type
Every cell has an assigned data type.
The default data type is General, but you can change it in the Properties palette or by using the editing tools from the Table contextual ribbon.
The default data type is General, but you can change it in the Properties palette or using the editing tools from the Edit Table contextual toolbar.
The default data type is General, but you can change it in the Properties palette or using the editing tools from the Edit Table contextual toolbar.
Note: You cannot change the data type of a cell that contains a formula.
The following data types are available:
- Angle
- Currency
- Date
- Decimal number
- General
- Note
- Percentage
- Point
- Whole number
Note: If a formula cannot identify the data type, it returns an error and the cell displays “####”.
To change the cell data type:
- In the graphics area, click inside a table cell to select it.
- On the ribbon, click Table > Data and select the data type.
- On the Edit Table toolbar, on the Data flyout, select the data type.
- On the Edit Table toolbar, on the Data flyout, select the data type.
Inserting Formulas
You can insert a formula into a cell with several methods:
- Manually
- Using formula tools
- Using the EditTableCell command
- Copying a formula from one cell to another, within the same table or to another table
- Copying a formula from a spreadsheet program
- Automatically filling table cells
Note: You cannot insert formulas in locked cells.
Inserting Formulas Manually
To insert formulas manually:
Note: The formula must start with the equal sign (=).
- Select a table cell to edit it in place:
- Click inside a cell to select it and type = (equal sign).
– or –
- Double-click a cell.
The cell switches to editing mode and the editing tools appear.
- Click inside a cell to select it and type = (equal sign).
- Type the formula.
You can use functions as in the following examples:
- =Sum(C3:D8). Adds the values from the cells in rows 3 through 8 in columns C and D.
- =Average(C3:D8). Calculates the average of the values from the cells in rows 3 through 8 in columns C and D.
- =Count(C3:D8). Counts the number of cells in rows 3 through 8 in columns C and D.
- =(C3+D3)/2. Adds the values of cell C3 and D3 and divides the result by 2.
- Press Enter to calculate the result.
Inserting Formulas Using Formula Tools
Formulas are available for a selected cell in the context menu and on a contextual toolbar or ribbon, according to the selected user interface.
Formulas are available for a selected cell on a contextual toolbar.
Formulas are available for a selected cell on a contextual toolbar.
You can also use these flyouts on the Table contextual ribbon to insert data types and formulas.
You can also use these flyouts on the Edit Table contextual toolbar to insert data types and formulas.
You can also use these flyouts on the Edit Table contextual toolbar to insert data types and formulas.
-
Data flyout
 . Lists the available data types.
 -
Formula flyout
 . Lists the available functions.
 -
Auto Formula flyout
 . Lists the functions that automatically generate the appropriate formula from adjacent cells within a column or a row. The application automatically detects the range and inserts the specified function in the cell.
Use Auto Formula functions for tables with lots of columns or rows. Auto Formula functions automatically calculate the sum or the average of a column, a row, or several adjacent cells in a column or in a row without a user specified range. If the specified Auto Formula function detects values in adjacent cells both, within the column and within the row, the column prevales.
To insert formulas using formula tools:
- Click inside a table cell to select it.
- Do one of the following:
- On the Table contextual ribbon, click the Formula flyout and select the formula.
- On the Edit Table contextual toolbar, click the Formula flyout and select the formula.
- Right-click and click Sum, Average, Count, or Cell.
- Specify the cell or the range of cells corresponding to the selected formula.
- Press Enter to calculate the result.
To insert formulas using Auto Formula tools:
- Click inside a table cell to select it.
For example:
- To sum a column, specify the cell immediately below the last cell with a number in the column.
- To sum a row, specify the cell next to the last cell with a number in the row.
- Do one of the following:
- On the Table contextual ribbon, click the Auto Formula flyout and select the formula.
- On the Edit Table contextual toolbar, click the Auto Formula flyout and select the formula.
- Right-click and click Auto Formula and select the formula.
You can select Sum, Average, or Count.
Note: In most cases, Auto Formula functions detect the correct range automatically. However, when the function displays an incorrect range, you can correct it manually by typing the desired range in the cell.
- Press Enter.
The calculated value appears in the cell.
Example:
The following table shows how to calculate the sum for each column.
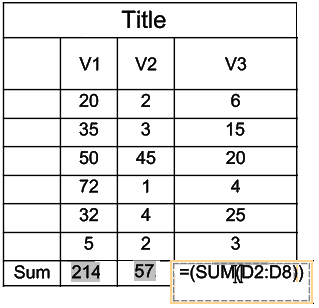
Inserting Formulas Using the EditTableCell Command
You can use the EditTableCell command to insert formulas and change the data type of cells.
To insert formulas using the EditTableCell command:
- Type EditTableCell at the command prompt.
- In the graphics area, specify a table.
- At the command prompt, specify the cell in which to insert the formula in the format An, where A stands for column indicator(s) and n stands for row number(s).
- Specify the Formula option.
- Use the following options to insert a formula in the specified cell:
-
Sum, Average, Count. Inserts the corresponding formula in the specified cell.
To specify the cell range:
- In the graphics area, click inside the first cell of the range.
- Click inside the last cell of the range.
The formula appears containing the specified range as its argument.
- Press Enter to calculate the result.
-
Cell. Inserts the selected cell identifier in the formula cell.
- Specify the Cell option.
- In the graphics area, click inside a cell.
The identifier of the specified cell appears in the formula cell.
- Press Enter to calculate the result.
Note: Use the Cell option to select a cell in another table within the same drawing.
- Equation. Switches the formula cell to editing mode and the equal sign appears. Type the equation and press Enter to calculate the result.
- Exit. Exits formula options.
-
Sum, Average, Count. Inserts the corresponding formula in the specified cell.
- Repeat step 5 as needed.
- Specify Exit to close the command.
To change the data types of cells:
- Type EditTableCell at the command prompt.
- In the graphics area, specify a table.
- Specify a cell or a range of cells in the format An or An:An, where A stands for column indicator(s) and n stands for row number(s).
- Specify the Datatype option.
- Specify a data type: Angle, Currency, Date, Decimal number, General, Note, Percentage, Point, Whole number.
- Specify Exit to exit the data type selection.
- Specify Exit to close the command.
Copying Formulas to Another Cell
You can copy a formula to another cell within the same table. The range of cells changes according to the new location.
To keep the same range, insert the dollar sign ($) in front of the column or row identifier.
Example:
The following table shows how to control the copy behavior using the dollar sign ($):
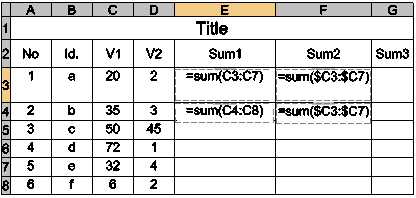
- Cell E3 cell contains: Sum(C3:C7)
If you copy the formula to cell E4, it updates to Sum(C4:C8).
- Cell F3 contains: Sum($C3:$C7)
If you copy the formula to cell F4, it remains unchanged as Sum($C3:$C7).
Inserting Data Automatically
You can insert data automatically in adjacent cells.
Drag the specific grip of the selected cell over the adjacent cells. The values increment according to the cell data type.
Examples:
- Numbers fill automatically by increments of 1.
- Dates fill automatically by increments of one day.
Filling Data Automatically in Table Cells
You can automatically fill cells with custom data that follows a pattern or based on data in other cells. A special grip point, called auto-fill grip point, in the lower right corner of the cell, lets you automatically add incremental values in cells by dragging, just as in Excel. You can also combine text and numbers in the same cell.
To automatically fill cell data, click and drag the light blue grip point to the desired cell and click to place the data.
You can use the auto-fill grip point for the following operations:
- Copy cell contents from a specified cell to a range of cells. The same value appears in the adjacent cells of the table.
- Automatically fill Incremental data, such as consecutive numbers or consecutive dates.
- Automatically fill data from a series of custom values. You can define your own customized lists which you can use later to automatically fill adjacent table cells. The application provides a set of predefined lists, such as days of the week and months.
Optionally, you can lock a specified range of cells to prevent content or format change during automatic fill.
Example:
Define a custom list for all materials available for a project. You can get the entire list whenever it is necessary by dragging. When you type a material name in a cell and drag the grip point then other materials are filled in the cell automatically with remaining values.
You can do the following:
- Copy cell contents from a selected cell to adjacent cells
- Automatically increment cell contents with consecutive numbers
- Automatically increment cell contents with a step
- Automatically fill cell contents with custom data
The basic workflow for working with custom lists includes the following steps:
-
Define the custom list that contains items to use to automatically fill cells later.
In the Custom List dialog box, select New List.
-
Populate the custom list.
Use one of the following methods to populate custom lists:
- Manually typing the data
- Importing a range of cells
- Importing data from a CSV file
-
Optionally, lock cells that you want to protect.
Lock the content or the format of a cell. Lock options are available in the cells context menu.
-
Apply the custom list.
Once you defined the custom list, you can use it to automatically fill table cells by dragging the autofill grip point up, down, left, or right.
To autofill incremental values within a table:
- Select the starting cell.
- Click and drag the autofill grip point across a row or a column to define the autofill area.
Specified cells are automatically filled with consecutive numbers.
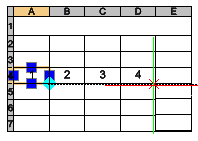
-
Click to place the data.
Tip: The grip point works with numbers as well as with dates.
To autofill incremental values with a step:
- Select two adjacent cells with the values to increment. For example, 1 and 3. The difference between the values is the incremental step.
- Click and drag the autofill grip point to define the autofill area.
Specified cells are automatically filled with numbers with the defined incremental step.
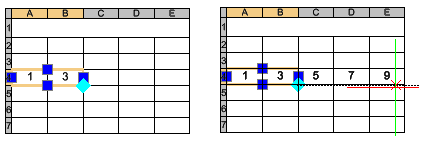
- Click to place the data.
To automatically fill cells based on a custom list:
- Double-click a cell and type an item name from the list.
- Click and drag the autofill grip point across a row or a column to define the autofill area.
Specified cells are automatically filled with consecutive items from the list.
To define a custom list:
- Select a table cell.
- Right-click and select Custom List from the context menu.
- In the Custom List dialog box, select New List.
- To populate the custom list, do one of the following:
- Manually. In the List Items field, type each item of the custom list on a new line. To separate one item from another, press Enter.
- Import values from a cell range. Click Import cells. In the graphics area, specify the range of cells from which to import values.
- Import values from .csv file. Click Import and select the file.
Available items are displayed in the List Items field. The list also sets the order.
- Click Add.
The list of items appears below the existing lists.
To delete a custom list:
- Select a table cell.
- Right-click and select Custom List from the context menu.
- In the Custom List dialog box, select the list to delete.
Note: You cannot remove or modify predefined lists.
- Click Delete.
To lock a range of table cells:
- In the graphics area, select the cells to protect.
- Right-click and select Locking from the context menu, then specify the locking options:
- Content Locked.
- Format Locked.
- Content and Format Locked.
The content or format of the locked cells, according to the selected locking option, does not change when you are automatically inserting incremental data.
Access
Command: EditTableCell
Menu: Modify > Entities > Table Cells
Exporting Tables
Use the ExportTable command to export tables in a comma separated format (CSV).
CSV (Comma-separated Values) is an ASCII file format that stores tabular data for spreadsheet or database software. Commas separate cell values. Strings are enclosed by single quotation marks. You can import CSV files in Microsoft Excel or other CSV compatible applications.
Note: CSV files do not retain text formatting or table formatting, such as cell color, merged cells and border style.
To export tables:
- In the graphics area, specify the table.
- Do one of the following:
- On the ribbon, click Annotate > Table > Export Table.
- Right-click and click Export Table.
- Type ExportTable.
- In the dialog box, specify the following:
- Save in. Navigate to the folder where you want to store the file.
- File name. Type a name for the file.
- Click Save.
The command generates the CSV file.
Example:
Table:
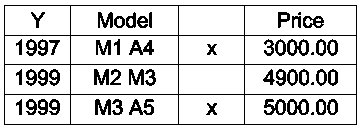
Export file (.csv format):
“Y”,”Model”,””,”Price”
“1997”,”M1 A4″,”x”,”3000.00″
“1999”,”M2 M3″,””,”4900.00″
“1999”,”M3 A5″,”x”,”5000.00″
Access
Command: ExportTable
Ribbon: Annotate > Table > Export Table
Linking Tables to External Data
You can use existing data from Microsoft Excel XLSX files when you create tables within a drawing.
This topic discusses:
- About Linking Tables to External Data
- Creating and Managing Data Links
- Updating Tables Linked to External Data
About Linking Tables to External Data
You can use existing data from Microsoft Excel XLSX files when you create tables within a drawing.
You can link to an entire spreadsheet or only to a cell or cell range by defining a so called data link.
Using the Data Link Manager dialog box, you can:
- Define a data link by selecting an XLSX file
- Specify a range in the XLSX file
- Open, rename, and delete existing data links
Additional options let you control how to convert cell content and table formatting from Microsoft Excel spreadsheets into the table on your drawing.
The DataLink command displays the Data Link Manager.
The workflow for creating a table based on an existing Microsoft Excel file includes the following steps:
- Establish a data link to the spreadsheet or cell range
- Create a table based on an existing data link
Note: By default, data links are locked to prevent accidental changes of the linked spreadsheets.
Any changes that occure in a linked spreadsheet can be automatically reflected in the table using the UpdateDataLink command.
Note: An alternative method to create tables from Excel files is to copy a range of cells and paste them into the graphics area.
Creating and Managing Data Links
Use the DataLink command to create and manage data links.
The DataLink command displays the Data Link Manager which groups all the tools necessary for creating, editing, and managing data links.
The Data Link Manager Dialog Box
The toolbar groups all the tools necessary for creating, editing, and managing data links.
| Button | Description |
|---|---|
 |
Creates a new data link |
| Changes the link to external data file of the selected data link | |
| Renames the selected data link Tip: Double-clicking the name of the datalink lets you edit its name. |
|
 |
Deletes the selected data link |
 |
Opens the data file linked to the selected data link |
 |
Controls the preview generation in the Preview area. |
List of Links
Displays the list of existing data links defined within the current drawing.
You can do the following:
- Right-clicking an item in the list displays a context menu.
- Clicking a data link displays a thumbnail preview in the Preview area.
- Double-clicking a data link displays the Edit Data Link dialog box.
Double-clicking an item in the list lets you edit the name of the datalink.
Options for working with data links
| Option | Function |
|---|---|
| Edit | Displays the Edit Data Link dialog box |
| Rename | Renames the selected data link |
| Delete | Deletes the selected data link |
| Open Linked Data File | Opens the data file linked to the selected data link. By default, the application uses Microsoft Excel to open XLSX files. However, Microsoft Excel is not installed on your computer, you can use another application to open data files. |
Creating a Table Based on an Microsoft Excel File
The workflow for creating a table based on an existing Microsoft Excel file includes the following steps:
- Establish a data link to the spreadsheet or cell range
- Create a table based on an existing data link
To establish a data link to an external file:
- Do one of the following:
- On the ribbon, select Insert > Data Linking > Datalink Manager.
- Type DataLink.
- In the Data Link Manager dialog box, click .
- Type the name for the data link and press Enter.
Using the same name as the data file can help you organize your data links better.
- In the Setup Data Link dialog box, click Browse and specify the files to be linked to.
- From the File Path drop-down list specify how to store the path to the data file.
- Relative path. Uses the file path according to the location of the file relative to the host drawing. Use a relative path when you share your drawings with your colleagues.
- Full path. Uses the full path of the file, including the root directory.
- In the Link range area, do the following:
- To link to the entire spreadsheet, click Entire sheet and select the sheet from the Link sheet drop-down list.
- To link to a cell range, click Cell range and specify the range of cells to link to your table.
Examples:
- Rectangular range: A2:C3
- Entire column: A:A
- Set of columns: A:F
- Optionally, click to specify how to import data from the Microsoft Excel spreadsheet. See Additional Options dialog box.
- Optionally, click to preview the sheet or the specified cell range.
- Click OK.
The data link is created. All data links that you create are available in the Insert Table dialog box.
To create a table based on an existing data link:
- Click Draw > Table (or type Table).
- In the Insert Table dialog box, do the following:
- In Insert options, select Insert from a data link. You can select an existing data link from the drop-down list. Alternatively, click
 and create a new data link using the Data Link Manager.
 - Make all other necessary settings as for a regular table. See Creating Tables.
- In Insert options, select Insert from a data link. You can select an existing data link from the drop-down list. Alternatively, click
- Click OK.
- In the graphics area, specify the insertion point.
Additional Options Dialog Box
The options in this dialog box let you specify how to import data from the Microsoft Excel spreadsheet into the table on your drawing.
Retain data formats and formulas
Imports all data from the Microsoft Excel preserving data formats and formulas.
Retain data formats, solve formulas in Excel
Imports data formats and calculates formulas from the Microsoft Excel spreadsheet.
Convert data formats to text, solve formulas in Excel
Imports all data formats such as currency, time, and percentage as text and calculates formulas defined in the Microsoft Excel spreadsheet.
Allow writing to linked data
Enables the DataLinkUpdate command to update the Microsoft Excel spreadsheet according to the changes you make to the linked data in the drawing.
Inherit spreadsheet formatting
Lets you use formatting changes from the Microsoft Excel spreadsheet in the table from your drawing.
- Update table formatting on each sync with spreadsheet. Specifies whether formatting from the original Microsoft Excel spreadsheet is taken into account. When disabled, the formatting that you specified in the Insert Table dialog box is used.
- Inherit table formatting only once on creation. Uses the formatting from the Microsoft Excel spreadsheet only when creating the initial table. Any later update ignores format changes that you made in the Microsoft Excel spreadsheet.
Access
Command: DataLink
Menu: Insert > Data Link
Ribbon: Insert > Data Linking > Datalink Manager
Updating Tables Linked to External Data
Use the UpdateDataLink command to update the table in the drawing to reflect changes made in the linked spreadsheet.
To update data from a data link:
- Do one of the following:
- On the ribbon, select Insert > Extraction and Linking Data > Update Data Link Table.
- Type UpdateDataLink.
- In the graphics area, specify the table to update or specify options:
- DataLink name. Lets you specify the name of the data link to update. Type a data link name or specify the ? option to list existing data links.
- All datalinks. Update all data links in all tables from the drawing with data from the modified spreadsheets.
Access
Command: UpdateDataLink
Ribbon: Insert > Extraction and Linking data > Update Datalink Table
Inserting VoiceNotes
The VoiceNote command lets you record audio notes and embed them in drawings.
To create a VoiceNote:
- Click Insert > VoiceNote (or type VoiceNote).
- Select a point in the drawing where you would like to place the VoiceNote icon.
- The VoiceNote dialog box is then displayed allowing you to enter text and/or to record your voice.
Use the recorder buttons to record an audio VoiceNote.
- Once a voice note is entered, select the OK button.
The Block containing the VoiceNote
 inserts at the specified location.
Recording Your Voice
Note that to record your voice, you will need a microphone, audio hardware and audio software installed and properly configured. To playback your recording, speakers are also required.
To record your voice as a VoiceNote, either add or retrieve an existing VoiceNote icon after issuing the VoiceNote command. This will open the dialog box.
In the VoiceNote dialog box are four audio controls: record, play, pause and stop. Selecting the record control will record audio until the stop control is pressed. Each new recording completely removes the previous recording. You may playback a recording by selecting the play control. When recording or playing back audio, the pause and stop controls can be used as needed.
Retrieving or Changing VoiceNote Comments
VoiceNotes can easily be retrieved for reading, listening or also editing. Firstly choose Insert/Edit Voice Note from the menu or issue the VoiceNote command in any of the above-mentioned locations.
After selecting a VoiceNote icon in the drawing, the dialog box Comment… is displayed with the attached text and/or audio recording. You can read the text message (if there is one) in the dialog window, or you can click on the play button to play an audio recording.
Alternately, the text edit box may now be edited or a new speech recording made that overwrites a previous recording. The text or audio recording is updated when the OK button is selected.
Removing VoiceNote Comments
VoiceNotes can be removed by selecting Delete from the menu Edit.
Select the VoiceNote icon containing the comment to be removed. Removing this icon will remove the attached audio and/or text comments.
Notes
- VoiceNotes are primarily for use when the drawing file is loaded. The drawing file can be saved in DWG or DXF format, without losing the recorded information, however this information is not directly addressable in other CAD applications. These applications simply ignore their presence in the drawing file.
- VoiceNotes stored externally in the support directory can be exchanged with any other block. Within the drawing file, they are created with the current layer, LineColor and LineStyle settings. The scale factor of the inserted block is screen size divided by 9.
- VoiceNotes are not limited in size, as additional attributes are added for larger sized recordings.
In complex drawings, placing VoiceNotes on a unique layer can make them easier to locate.
Access
Command: VoiceNote
Menu: Insert > VoiceNote
Ribbon: Annotate > Revision > VoiceNote
Attaching Hyperlinks to Entities
The Hyperlink command attaches a hyperlink to an entity or modifies an existing hyperlink. Hyperlinks provide jumps to Web sites, email addresses, drawing files, or user-defined views in the current drawing.
To open the Hyperlink dialog box:
- Click Insert > Hyperlink (or type Hyperlink).
- Specify entities in the graphics area to which you want to apply hyperlinks, then press Enter.
- The Hyperlink dialog box appears.
To create a hyperlink to an existing file or web page:
- In the Hyperlink dialog box, click Existing File or Web Page.
- For Text, type a description for the hyperlink. Use this if the link itself is not meaningful enough.
- For Address, type the hyperlink.
- – or, click –
- Current Folder to navigate to the file you to which you want to hyperlink. The drive or folder in Look In determines the content of the file list.
- Browsed Pages (lists recently browsed Web sites from your Internet browser), then select a page from the list.
- Recent Files (lists files recently used), then select a file from the list.
- Click
 to select a file in the Open dialog box.
 - Click Target Frame to select a location in a drawing file to which to hyperlink.
- Click
 to open your standard web browser to search for web site addresses.
- Click OK.
To create a hyperlink to a named view in the current drawing:
- In the Hyperlink dialog box, click Place in This Drawing.
- In Select a place in this drawing, select a user-defined view.
- Click OK.
To create a hyperlink to an email address:
- In the Hyperlink dialog box, click Email Address.
- For Email address, type an address.
- – or –
- In List of recent email addresses, select an email address.
- For Subject, type text to set a subject for the email.
- Click OK.
- When the hyperlink is invoked, your email software creates an email to the specified address.
To display the hyperlink tooltip:
- Hover the pointer over an entity that contains a hyperlink.
To open the hyperlink:
- Press Ctrl and click the entity that contains the hyperlink.
Use the DetachLink command to detach hyperlinks from entities.
Access
Command: Hyperlink
Menu: Insert > Hyperlink
Keyboard Shortcut: Ctrl + K
Keyboard Shortcut: Ctrl + K
Keyboard Shortcut: Command + K
Ribbon: Insert > Data > Hyperlink